The need for effective visualization of data, calculations, analyses, and images has deeper historical roots than one might expect, and it will continue to grow as information sources expand.

Learning Objectives
- Understand the historical roots and evolution of data visualization from ancient times to modern-day technologies.
- Learn how contemporary data visualization tools and platforms enhance data connectivity, integrity and accessibility for users.
- Explore the role of industrial and business explorers in leveraging data visualization for optimized operations and strategic decision-making.
Advanced contextualization and visualization Insights
It would be easy to think that data visualization is a contemporary development, highly aligned with the rapid expansion of PCs and spreadsheet software; however, humans have been quantifying, recording, and depicting information since the dawn of civilization. Computing advances of recent decades have certainly expanded data visualization possibilities, and despite some believing that the ubiquity of computing devices and software today has curtailed our progress, this is certainly not the case.
In many ways we are just now entering a phase where data can be more fully utilized using newly developed tools. Doing so requires a platform providing complete data connectivity to sources of all types, easy visualization and accessibility to the information for any user, and assurance that the information has unquestionable integrity. Only when these three characteristics are combined can users fully unlock the value hidden within the ever-increasing volume of source data.
A look back at how humans have used and viewed data provides insights into how people, technology, and processes can now be combined to foster accelerated insights.
A historical view of data
As early as 1700 B.C., Bronze Age petroglyphs carved in what is now Sweden represented humans documenting data, and perhaps identifying ownership of ships and animals. The clay Nippur tablet discovered in modern day Iraq appears to have been created around 1400 B.C., and it exemplifies a tabular way of recording ox counts and usage — a quick glance reveals that it is truly a blueprint for modern spreadsheet design.
As time progressed, humans continued to strive for ways of curating and depicting data and analyses in useful and often visual ways. Euclid’s Pythagorean Theorem, circa 300 B.C., combined data, calculations, analysis and images. Other notable examples include:
A data table by the Exchequer of Ireland in 1500 for recording taxes.
Statistical graphics as founded by William Playfair in 1780s through his invention of line charts and pie charts for time-series data.
Least-squares regression analysis shown by Gauss in 1822 for finding the best-fitting curve for a set of data points.
Principal component analysis (PCA) — an early development of machine learning (ML) algorithms still in use today — invented in 1901 by Karl Pearson and useful for identifying structures, similarities, outliers, and differences in time-series and noisy data.
Plant Information (PI) System — originated in the 1980s as a revolutionary way to collect massive amounts of time-series data — which became essential for performing continuous process data analytics much as database technologies did the same for event data.
There are plenty of similar achievements in the 20th century, especially as digital computing capabilities increased. Digital processors, a proliferation of sensor types and widespread connectivity of consumer, commercial, and industrial systems resulted in an exponential growth of data sources.
A first step to extract value from so much raw data is to perform analytics on it to create insights. Effectively visualizing and sharing these results is essential to fully benefit from these data-driven efforts.
From curiosity into discovery
Continuing for a moment with the historical perspective, let’s look at what it means to be an explorer. Explorers of the Old World and today, share certain characteristics. They are curious about something, and they need to make the right moves leading to discovery and insights.
They are prompted by some type of initiative, perhaps just to gain knowledge, but more often for economic or other reasons. Explorers require some degree of executive support, as they prepare to enter new environments. This means gathering a variety of tools, and then assembling them into a complete platform. Explorers are looking to make a discovery, which might be exactly what they are looking for or something else of benefit. And in many cases, these results prompt further cycles of exploration and discovery.
Modern-day explorers in the context of business, industrial manufacturing and processing facilities operate similarly to others exploring the world and science. Explorers of industry are plant operators, engineers, and data scientists among others, who regardless of knowledge can all be referred to as industry explorers. Significant data is available and waiting to be leveraged to deliver useful discoveries. Following are some concepts familiar to industry explorers:
Initiative: Optimizing operations and product rates, minimizing waste and energy consumption, and improving overall profitability are significant driving factors for industry explorers.
Executive Support: The corporate office plays a role in exploration strategy because it is typically in control of budget, resources and timelines.
Environment: Today’s industrial explorers may have some hands-on field experience, and they rely on a technology landscape, with a need for centralized data access, synchronization with data sources, along with robust cybersecurity measures.
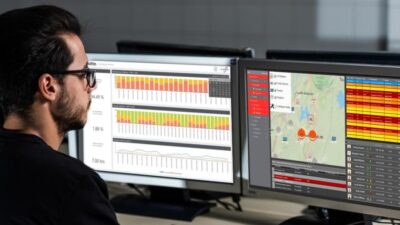
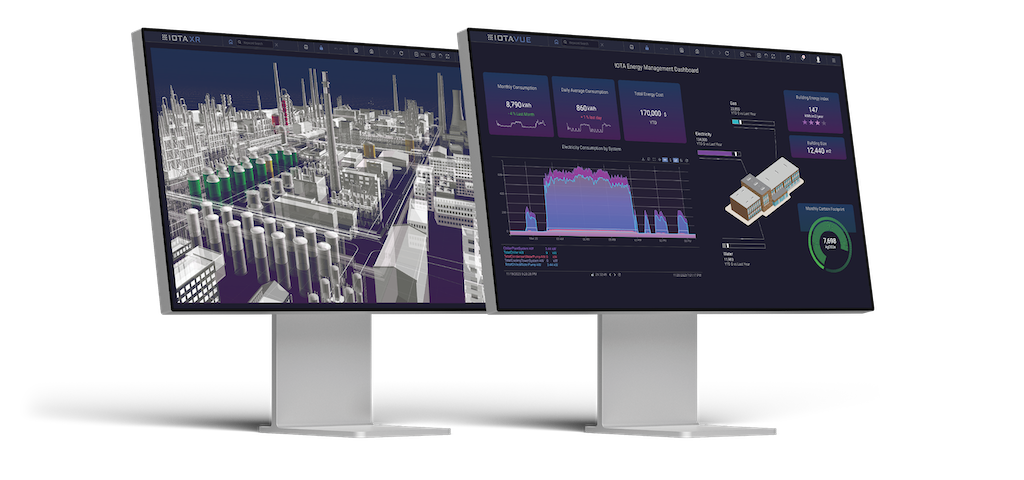
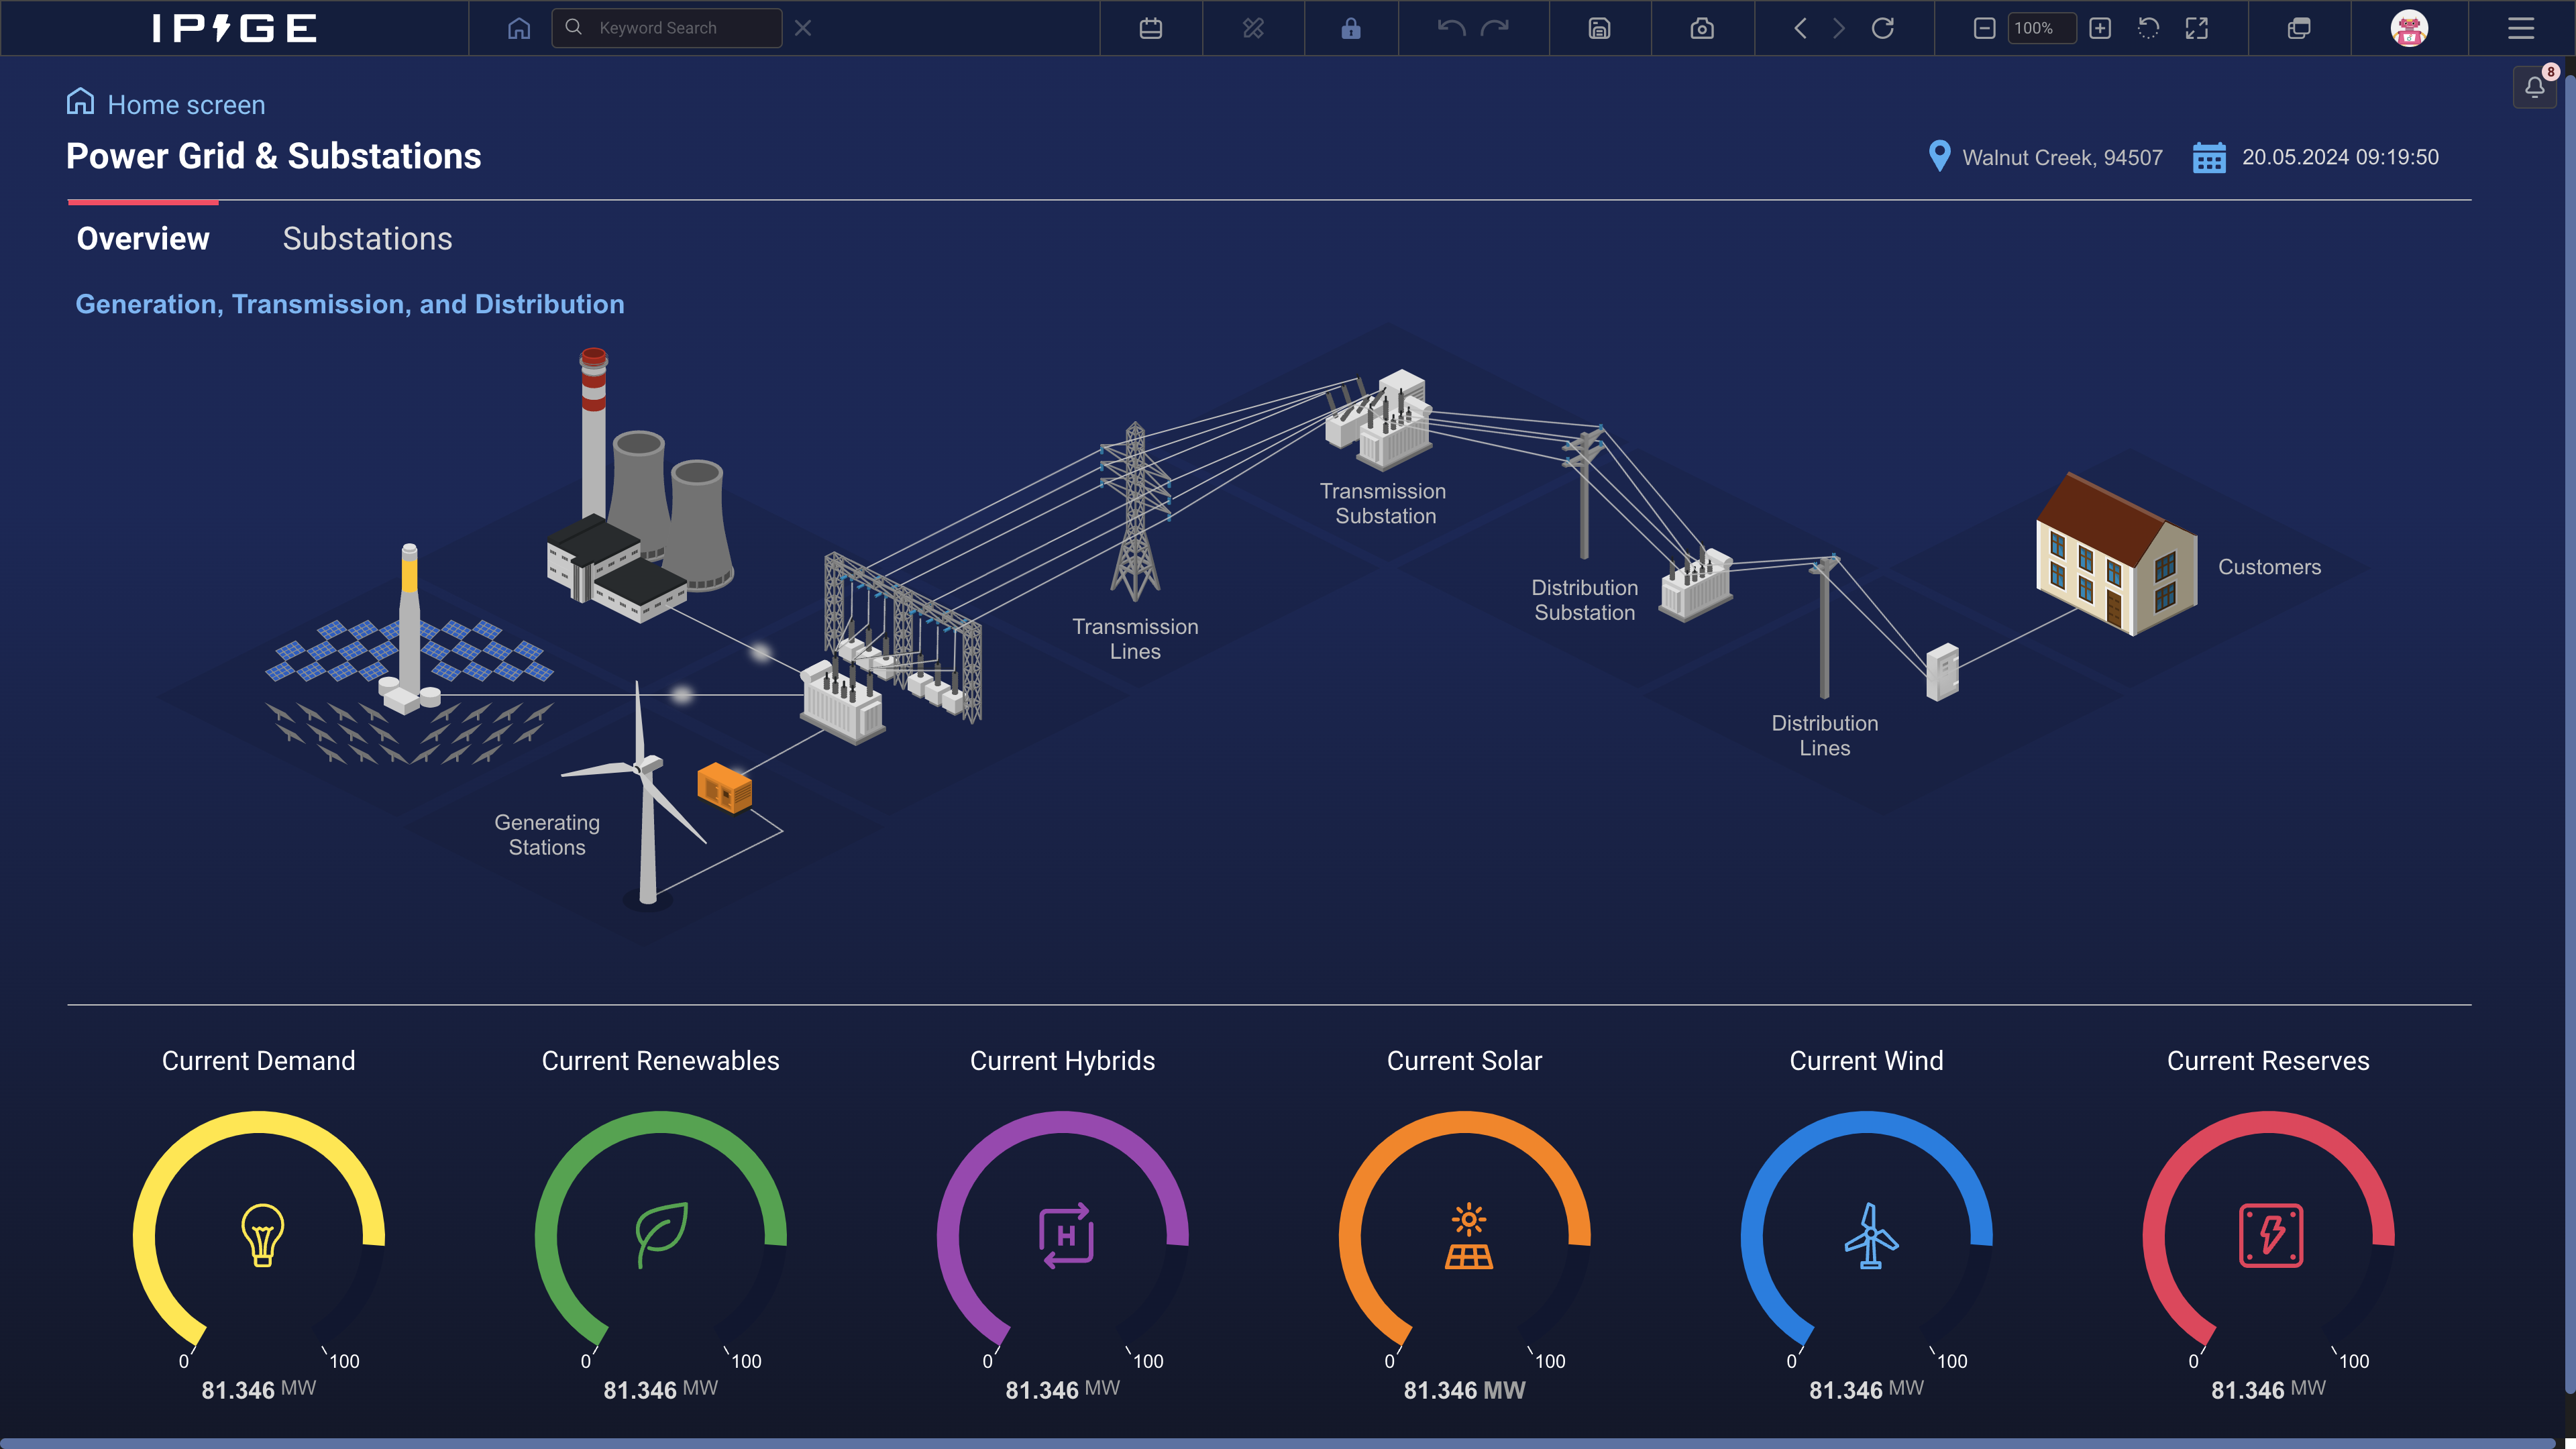
Tools: Industrial explorers connect with databases and time-series historians and they then use spreadsheets, along with other analytical and computational resources. More advanced needs include process visualization, 2D and 3D imaging, business information dashboards, and ways to collaborate smoothly with others as these tools are utilized.
Platform: The right platform for industrial explorers will aggregate all their data in one place regardless of data type and will offer a wide range of self-service visualization tools to accommodate their needs. Users can act on normal operating data and other sources such as maintenance records, financials, environmental information and more.
Discovery: The resulting discoveries may be troubleshooting a single problem, finding a better way to operate or something else entirely. Even a “dead end” is a type of discovery, indicating where the industrial explorer may not need to look. All discoveries can be looped back into a new process of exploration as part of an ongoing and iterative process of continuous improvement.
Data visualization powers discovery
As the introduction of this article noted, some readers may think that data visualization has already reached peak effectiveness. After all, spreadsheets contain some chart and graph functionality and other software provides various dashboarding capabilities. There are many options for supporting data analysis — such as spreadsheets, databases, and calculation tools — but while each of these elements is fundamental to pursuing data-driven discoveries, they are also limited in practice.
To see the complete picture, users most often need to combine the output from many tools. Performing this type of cross-product integration can be difficult and time-consuming, taking away from the core exploration goals. There is a great need among industry explorers for a way to consolidate their research efforts into a unified platform, so they can most effectively visualize and share results.

Using a central, unified platform, businesses have a consolidated way to carry out both daily tasks and strategic business evaluations, by equipping teams with tailored dashboards that empower informed decision-making. This platform serves as the core view of business operations, providing a self-service gateway and simplifying complex workflows into a streamlined process.
A complete solution needs to combine technology with people and processes (Figure 3), and it needs to do more than connect with some data and allow pie charts to be created. A future-proof data visualization approach must address the following points, by being:
Aware of both common and atypical data sources and their contextual structure, including user databases (MS SQL, MS Azure, GCP, AWS and others), historians (PI System, Snowflake and others), AVEVA Data Hub, Seeq analytics and other process analytical software, and corporate and commercial information.
Data agnostic, connecting transparently and directly to the data sources wherever they are, without any required replication, which is costly and can introduce synchronization issues.
Able to replace redundant tools and augment current tools, to create a seamless, integrated ecosystem, for rendering existing displays and processes with minimal disruption, managing data quality and analytics close to the source, and providing a sandbox environment for securely testing new operational plans.
Installable on-premises, virtualized, private cloud or public cloud, or a hybrid of these four environments, providing a flexible and scalable solution for bridging information technology (IT) and operational technology (OT) environments.
Outfitted with customizable, self-service interfaces suitable for all user levels, ranging from administrator to application creator, to power users or even casual users.
Provisioned with easy-to-use self-service graphical objects, integrated such that the end results are presented as one complete and cohesive system.


Industry explorers need the ability to interact with sites, assets, and data so they can pursue business initiatives and work with people at all levels of the enterprise to create insights. The data, communications infrastructure, and processing power are available today — and these technologies deliver full value when used with a comprehensive visualization platform to support users on their pathway to discovery.
Sasha Jones is the director of product and customer success at IOTA Software. Petter Mörée is the managing director of IOTA Software. Edited by Tyler Wall, associate editor, WTWH Media, [email protected].