Power monitoring device insights
- Before using or designing a power monitoring device (PMD), understand PMD principles, challenges, engineering and some ANSI standards that will help, with eight figures and seven equations.
- Voltage and current sampling considerations are important when using or designing PMDs.
- Power demand and total energy are important to understand with power monitoring devices.
Commercially available power metering devices/modules may fit your automation and control application, or you might want something different, which would suit better to your customers’ needs. Several such power monitoring (or transducer) modules/devices have been manufactured and sold, including those from Emerson Electric Co. Understanding the anatomy of power monitoring devices can help good engineers to improve their design of a perfect power monitoring device (PMD) , which would fit the automation and control application even for the distributed energy resources.
Introduction: What is a power-monitoring device?
So, what is a power monitoring device? It’s an electronic device/instrument capable of measuring of the electrical parameters (voltages, currents, powers) of 3-phase electrical grids. Who needs such a device? Any industrial company may need to measure such parameters/powers for its own use, for example, to detect (and avoid) a poor power factor. If your company manufactures electric motors and/or generators, such a PMD unit could accompany your products. A more sophisticated power monitoring module can be used as a ground fault relay, or even as a synchronizing device for connecting electric generator to the public grid.
A basic PMD needs to measure phase voltages and currents of a 3-phase electric grid and provide them to the user. To measure and then to process such high voltage and current values, suitable transformers usually are needed. Transformers reduce the measured parameters to the acceptable amplitudes for the processing and isolate the dangerous, high voltage system from electronic instruments (and personnel in the area). Figure 1 shows a schematic of such a 3-phase four-wire (WYE) system with three potential transformers (PTs) and three current transformers (CTs).
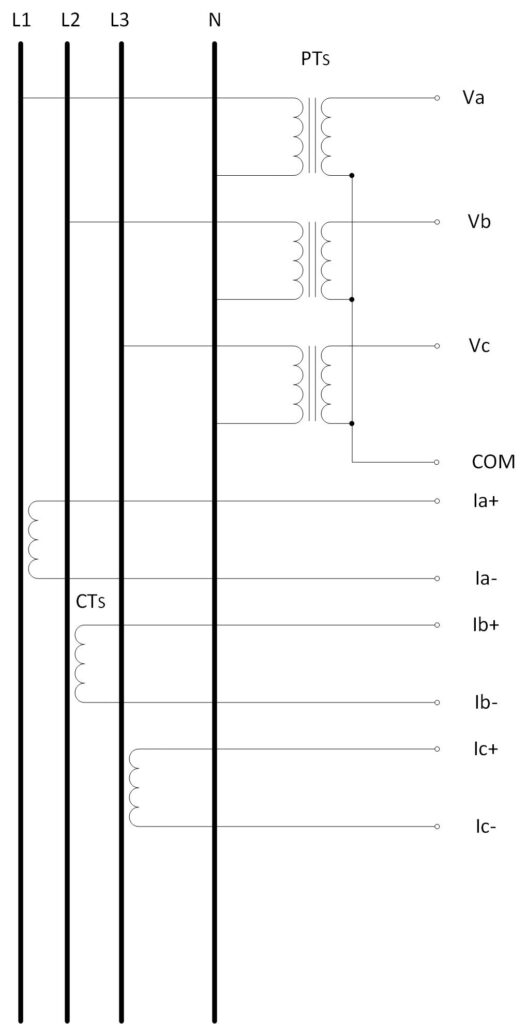
Many suitable potential and current transformers are available on the market. You need to select such transformers, which will provide safe output voltages (and currents), for further processing. For example, a PT with the ratio 100:1 will be suitable to measure voltages in the range of 480V, as the output of 4.8V is perfect for the further (TTL) processing. However, such a nominal 480VAC voltage, when sampled, it will reach up to √2 [sqrt(2)] times higher value (a peak value). In addition, those sampled values will be positive and negative as well, so a further voltage reduction (and offsetting) will have to be applied to match the input requirements of used analog-to-digital (A/D) converter. The current transformers are of a donut-type where the primary winding is the phase line conductor which passes through the center of the CT. Their output still can be a significant current value (~ Amps), so your device will need to use additional transformers to further reduce those current values.
A configuration shown in Figure 1 is fully suitable for the voltage/current and power (power factor) monitoring of such a load/appliance like a 3-phase electric motor. If you added another CT, which would measure the neutral current, you could even monitor any ground fault (current leakage) of the load, as the total current flow to/from the load has to be zero if there is no fault.
More powerful 3-phase loads (like motors) are usually configured in the delta connection. It means that the neutral (N) line is not used. It may not be even available for your power monitoring device. In such a case, a so called “two wattmeter method” can be used, as it is shown in Figure 2. In the pictured case as a “common” phase, the phase B (Line 2) has been used.
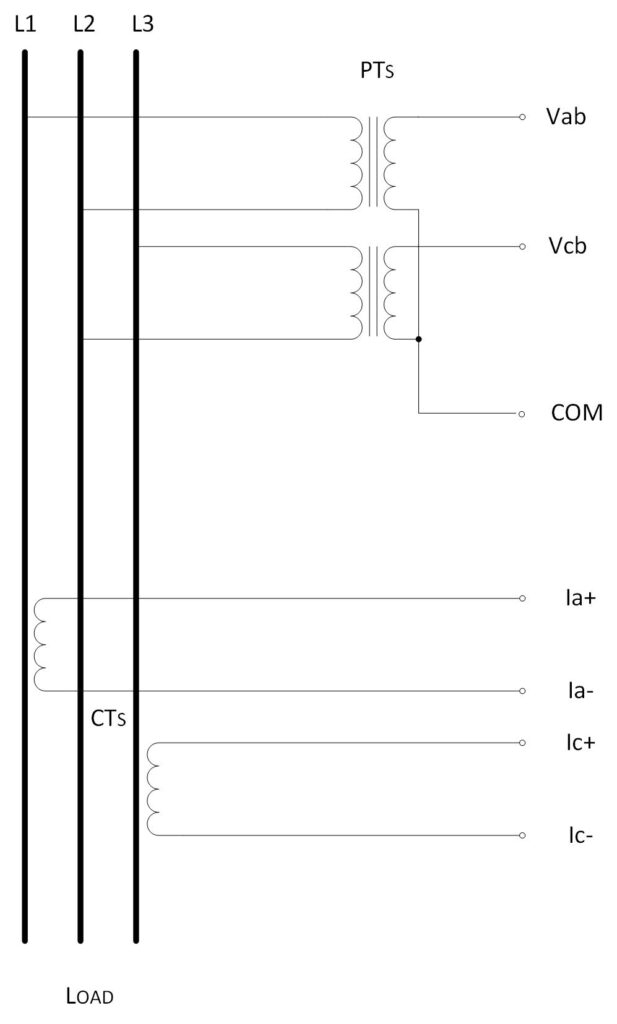
While such a three-wire delta system with two PTs and two CTs (two wattmeter method) is a perfect method for any load power consumption monitoring, it will not be able to detect any current leakage (ground fault). Just add the third CT (on the common line L2) and by calculating the sum of all three line currents, you can detect such a ground fault as well.
Basic math behind 3-phase power monitoring
The math behind 3-phase power monitoring is explained below. The voltage, V, and the current, I, calculations are based on the root-mean-square (RMS) calculation:
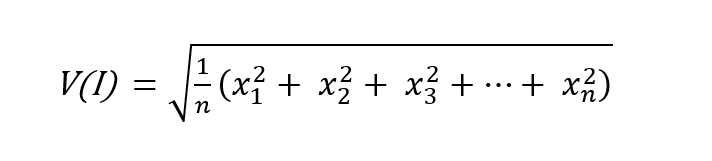
where individual xi values are samples taken from the monitored voltage, vi or the current, ii . The power calculation is based on a similar formula, just the square root is omitted:
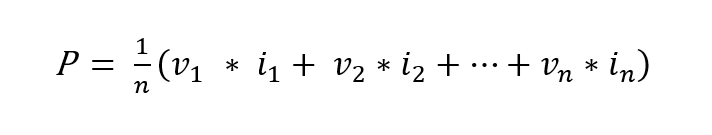
Regarding the power calculation, equation 2 provides the phase active power value. Why it is so? Because the voltage sample value, viis multiplied by the current sample value, ii as it is present at a given sampling time (it has to be the same time). Any phase shift between the voltage and current cycle is automatically taken into account. So, how we can calculate the apparent or total power value? There are two options. One is based on a simple multiplication of already calculated V and I values. The other option is through the calculation of the reactive power, Q. Reactive power can be calculated similarly like the active power, just in Formula 2 use the current samples, which are one quarter of the period (that is n/4) shifted. For example, if you use 128 samples per cycle, calculate products of vi * Ii+32 .
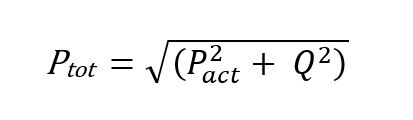
Once you have the active and reactive power values calculated per each phase, add them (calculate Pact = PA + PB + PC , Q = QA + QB + QC ) and the apparent (or total, Ptot) power value of the entire 3-phase load can be found as:
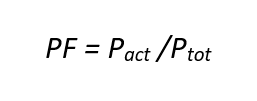
And the three-phase power factor, PF, will be:
When you apply the two-wattmeter method (if your load is configured in a delta connection and the neutral line is not available), situation is a little bit different. Figure 3 shows the phase diagrams of the WYE and delta configurations.
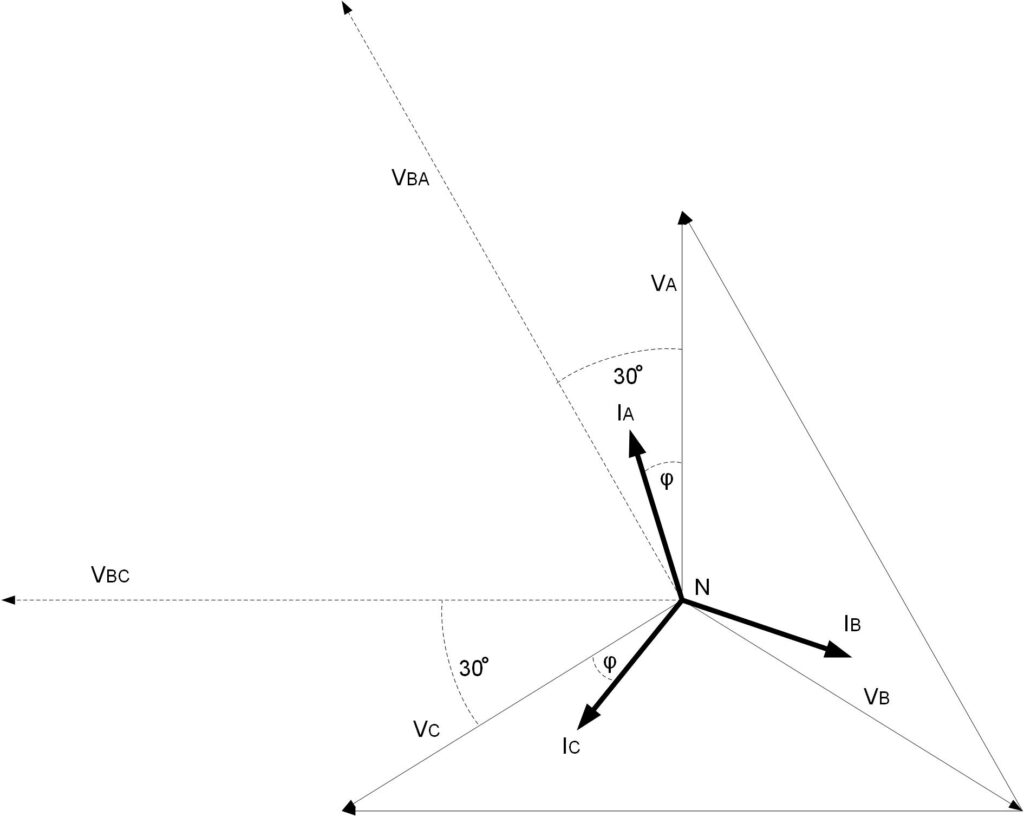
A mathematical comment regarding the vectors denotation: Strictly speaking, the voltage and the current vectors should be denoted as VNA, VNB, … INA (in the WYE configuration) but for simplicity, if the vector originates on the neutral line, N, the N symbol is usually omitted. The line current vectors, IA, IB, IC (in the delta configuration they should be named as IL1, IL2, IL3*) depend on both surrounding branches/impedances, so to use the second symbol wouldn’t make sense. And the phase-to-phase voltage vectors may have the vector tail and head swapped, like instead of VBA, VBC in this article you can find Vab, Vcb. In both cases those vectors denote the phase-to phase voltage vectors, which have the phase B (L2) as common, because the letter B (b) is present in both vectors. The phase A (L1) is never used as a common phase, however the phase C (L3) can be common as well.
*Please note that in this article the term “phase” and “line” may not be strictly observed. While in the WYE configuration they have actually identical meaning, in the delta configuration they are not identical.
Figure 3 shows all the relations among the voltage and current vectors for both, the WYE and delta configuration.
As we already know the two-wattmeter method is based on the measurement of just two (phase-to-phase) voltages and two-line currents. If we select as a common phase the phase B, our measured voltages will be VBA, VBC and the measured currents IA and IC.
What is the total 3-phase power of such a system? Using Formula 2, where the vi values represent the sampled VBA voltage and the ii values are the sampled IA current, you will get the first part of the active power of the entire 3-phase system. Adding the second result of the same calculation where the vi values represent the sampled VBC voltage and the ii values are the sampled IC current, you will get the total 3-phase active power. Now, to calculate the total 3-phase apparent power, Ptot, you will either calculate at first the reactive power, Q, (similarly like described above for the WYE configuration) and then you will use Formula 3. Or, much simpler way is to calculate it directly from already calculated RMS voltage and current values. The formula for the total 3-phase system, active power calculation is:

How to get total apparent power
However, omit the voltage-current phase shift, φ, (we don’t even know this value, as we don’t calculate it), and what you will get is the total apparent power, Ptot.
While the three-wire delta system with two PTs and two CTs (two wattmeter method) is a perfect method for the total 3-phase power consumption measurement, you can’t find precisely the power consumption of each individual phase. This is very rarely important, but if yes, just make an estimation by a simple division of the total power by 3.
As it was mentioned before, one nice feature of such a PMD would be the ability to detect the ground fault. What is actually ground fault? Briefly, ground fault is a situation when your power load (motor) exhibits any kind of the current leakage due to deteriorating isolation. As such power appliance (its chassis) has to be grounded, any such current leak would end up into ground.
Please note: This is a safety precaution, but it doesn’t mean that a faulty device or appliance with a ground fault can be used. It must be removed from the grid.
But can such a faulty (deteriorating) load be detected? Do you remember Kirchhoff’s current law? It states that the current flowing into a node (or a junction) must be equal to the current flowing out of it. And this is what your PMD can easily do. Use Formula 1 (RMS calculation) to calculate the ICOM current where, as the individual xi values use a sum of all the current samples. In the case of 4-wire (WYE) configuration you need to measure/sample and sum all four current samples: xi = iai + ibi + ici + ini .
In the case of the 3-wire (delta) configuration the line currents have to be added, but all three of them, even the current flowing along the common line.
How to use a non-zero leakage current value
And how to use such a non-zero leakage (common – ICOM) current value? Usually very small values can be tolerated, but as the leakage current reaches a certain level, such faulty device should be immediately disconnected. Your PMD can do that via a suitable relay.
What else can be useful for such a 3-phase electric system monitoring? You might calculate a DC component of the 3-phase voltage. However, in the configurations as shown in Figure 1 and 2, you can’t detect any DC offset of the monitored 3-phase system as the primary and secondary windings of the PTs are completely independent, so you will read permanently zero. However, there is a way to design PMD, which won’t use any PT, and then such a DC voltage monitoring/calculation will be extremely important. Figure 4 shows a simplified diagram how to sample directly all 3 line voltages (and the neutral voltage, Vn , available in the WYE configuration) without using any potential transformer. Of course, all the voltages have to be scaled down by suitable resistors. And “suitable” doesn’t mean just having the correct ratio (like 1000:1), but they have to be precise, and, especially very stable toward the temperature changes, that is you will have to use resistors with a small ppm/°C (parts per million per degree centigrade) coefficient. Their precision might not be as important as their temperature stability, because your PMD device, once fully assembled and tested, it will have to be calibrated anyway.
In Figure 4, the voltmeter with the switch represents an analog-to-digital converter with a multiplexer, which is a standard arrangement of a multi-channel scanning/digitizing device.
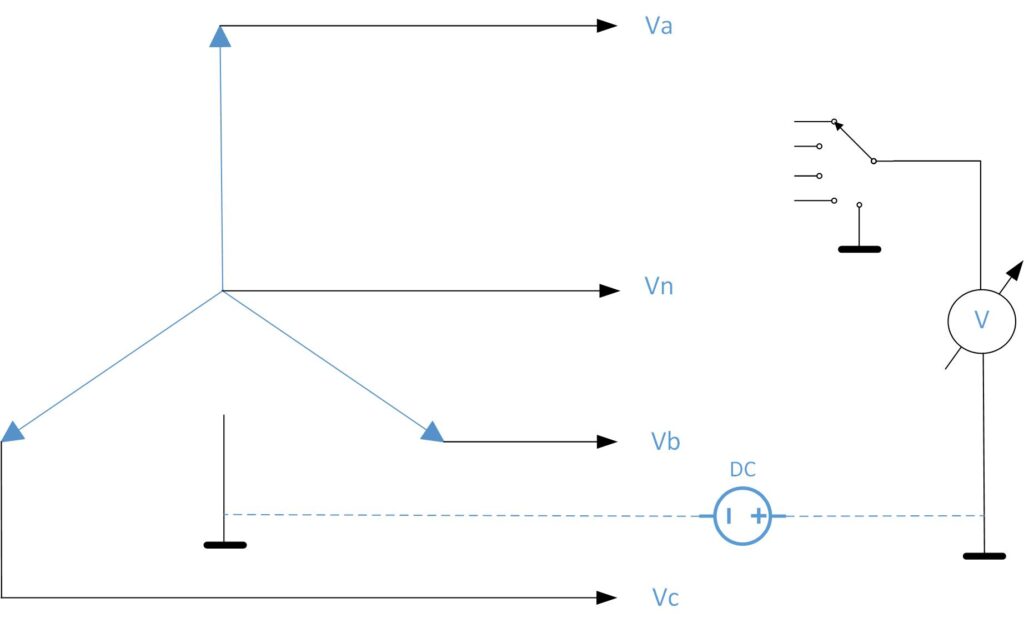
So, how the direct voltage measurement can be practically implemented? All those voltages are actually “floating,” meaning the ground potential of their 3-phase grid is not connected with the PMD ground, so how it will work? The answer is pretty simple as all the grounds are actually interconnected, just any two ground points may have a different (relative) potential. At first you will need to calculate the DC offset of that (remote) 3-phase grid. In the case of the WYE configuration, you can sample just the neutral voltage, Vn. Take those n samples, and, instead of the RMS calculation, just add all those samples and divide by their number (n) to get the average value. And this is your voff value. This value is not in volts, it is still in term of your samples value, that is, in counts or bits (that’s why the capital V is not used). So, how high can such a VCOM (converted voff value into volts) be? If your PMD device is not far from the monitored load (like a 3-phase motor), then those separated grounds should have a very close potential, the difference can be in the order of volts at maximum.
The importance of voltage protection
However, occasionally, like during the thunderstorm, this voltage can momentarily reach hundreds of volts. A rigorous protection of your device against such voltage surges (even if you employ PTs) is essential.
In the delta configuration, you can use samples of all three phase voltages (delta even doesn’t provide Vn.). To calculate the voff value, add those 3*n samples together and divide by a 3*n value.
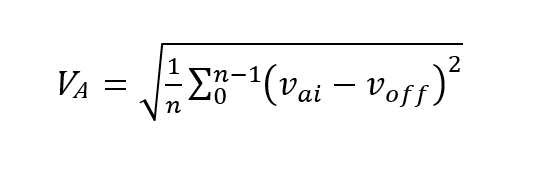
Now, once you have the voff value (it has to be calculated as a first value), you can calculate the RMS values of the phase (or phase-to-phase) voltages. You just have to subtract this voff value from each voltage sample. For example, the phase A voltage, VA , will be calculated as:
Or the phase-to-phase voltage, VAB, (with the common phase B) will be calculated as:
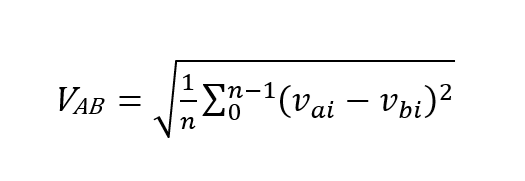
Notice that the phase-to-phase RMS voltage calculation formula doesn’t use voff offset, as we are interested only into a relative voltage. So, do we need to calculate voff in the delta configuration at all? The answer is yes, as it might be important information, for example, for the auxiliary generator connection to the public grid and in some other special situations.
All the voltages, currents and powers should be reported in the standard units (volts [V], amps [A] and watts [W]/volt-amps[VA]). They will be obtained after conversion of their RMS values (in counts/bits). Their conversion coefficients need to be calculated based on the A/D converter range and the range of the measured parameters (voltages, currents and powers).
Voltage/current sampling considerations with PMDs
A first question might be, how many samples have to be used? There are more options. At first, those samples have to be taken from one (or several) full power cycle. So, your PMD device has to be able to detect a beginning of a power cycle, for example, as a zero crossing of a phase A voltage. Two consequent zero crossing then give you information about half of the power cycle duration/period. So, every second zero crossing in the North America grid should occur every 1/60 of second (16.666 ms); in Europe it will be every 1/50 of second, that is, every 20.0 ms. But generally, this line power frequency can (though very little) vary, so you can’t rely on those constants, you need to measure them.
Now you need to decide how many samples of a monitored variable you are going to use in the calculation formulas. While more samples generally provide better precision, a practical number of samples is around 100/cycle, so to take 128 samples (it has advantage of selecting such a power of 2 value) can be optimal.
Once you have taken and saved all samples of all the measured variables, you can process them. However, the results (voltages, currents and powers) might be a little bit “noisy,” as there are always certain variations in the zero-crossing detection, for example, and the A/D converters as well have a limited precision/resolution. For the practical use, it is good idea to put those calculated results through a (moving window) filter, for example, eight cycles long. Here you can save a lot of calculations, if, instead you take samples of eight cycles, and only then process them. Doing so provides similarly filtered results. But yes, you will have to save those 1,024 samples of each measured variable. And the results can’t be reported/updated more often than once per eight cycles. That decision belongs to you or your customer.
Important processing considerations
Your processor should be able to save the digitized samples alternatively in two memory sections. While you are processing samples from one memory section, currently digitized samples are being stored into the second memory section and so on. This is required because the total processing time of all samples/channels can take up to half of a power cycle (~ 10ms), but the sampling has to run continuously without any interruption.
A great importance has the sequence of the individual channel sampling. You need to sample up to 4 voltage channels and four current channels. You might need to sample periodically other parameters as well, like the reference voltage, so you could make a periodical calibration.
Important note: For a precise power calculation, it is important that the corresponding voltage-current channels are sampled simultaneously, as any time shift may be wrongly interpreted as a phase shift between the voltage and the current of a given phase! It is recommended to use two A/D converters, which would sample those corresponding voltage and current channels simultaneously.
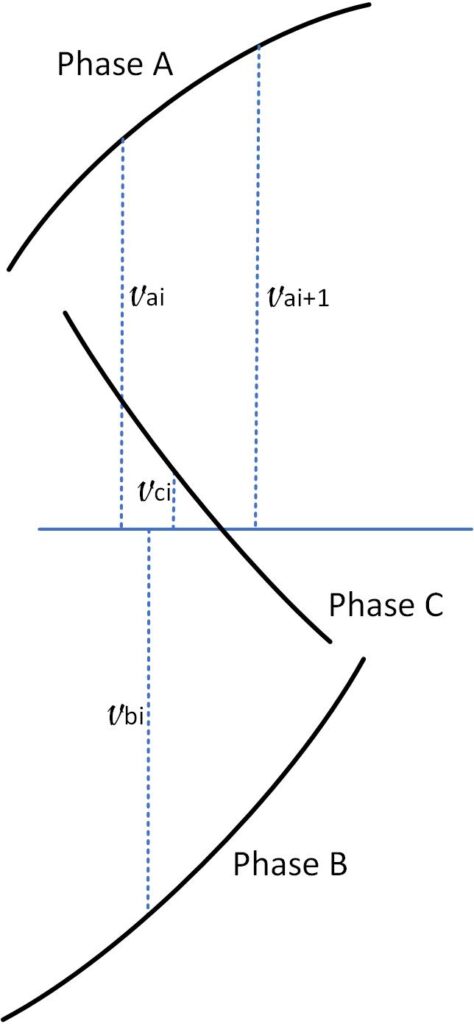
But even the phase voltages (and currents) among themselves ought to be sampled so that that the sampling will not introduce any additional phase shift. Obviously, you would not use a separate A/D converter for each channel. You will be sampling them sequentially, using an analog multiplexer in front of one A/D converter. Such sampling inevitably produces a time shift, which will grow with each following sampled channel. Can you somehow eliminate this time (actually phase) shift? Yes, you can, but before you take the sample for processing, you need to apply interpolation. Figure 5 explains the need for such interpolation. Of course, not all the samples need to be interpolated.
For example, when you calculate RMS values of the individual phase voltages (equation 6), no interpolation is needed. But equation 7 definitely requires all samples to be properly adjusted for any sampling time shift. For simplicity, Figure 5 shows just 4 channels sampling 3-phase voltage (the fourth channel not shown). So, the analog multiplexer continuously is switching – connecting the input of a monitored channel to the A/D converter in the order as shown in Figure 5. It is evident that the vbi , vci (and the following, not shown sample) is taken later than the vai sample, so to avoid any error in the samples processing, we need to know their values, which would be there if taken exactly at the same time. By selecting a certain channels number (4, 8,..) such an interpolation can be calculated very fast, as it will require just few shifts (to the right), which every processor (usually a digital signal processor) can calculate very fast.
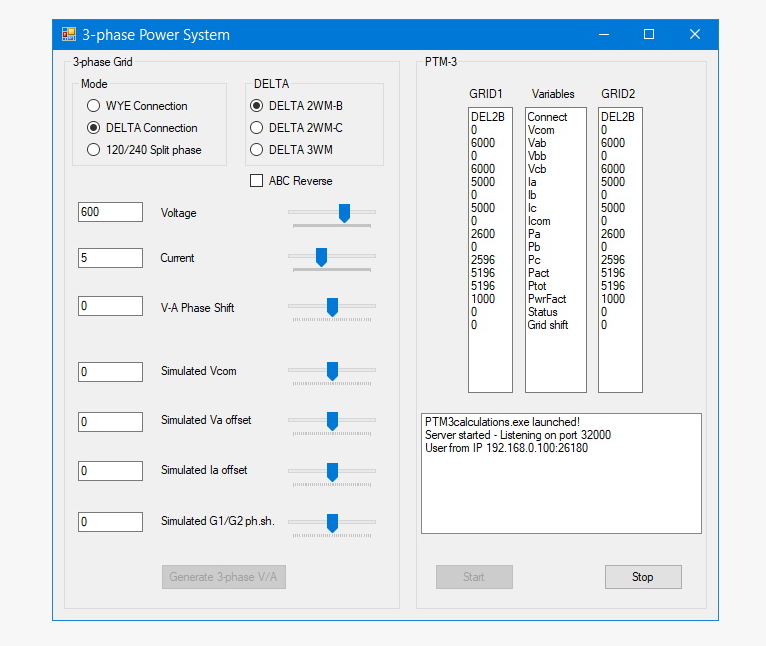
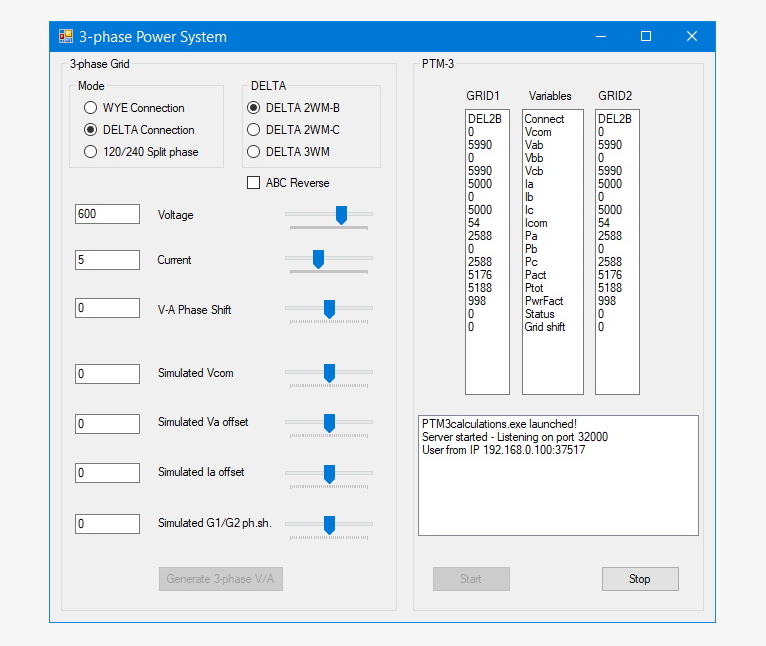
The last question is whether or not it is worth dealing with the (rather complicated) interpolation at all. How much error would we introduce, if we don’t apply it? Here is the answer. Compare the results shown in Figure 6 and Figure 7. While not “tragic,” the error is visibly present. The PMD simulator calculates those results by taking 128 samples from a full power cycle with 8 scanning channels. It means that the phase shift between any two adjacent channels is roughly one thousandths of a full cycle (360˚). If using just four channels (see Figure 5), the error would be roughly twice as high.
Additional PMD features: Power demand, total energy
So far, we’ve learned how to calculate the basic, 3-phase power parameters. Again, they are:
Power line frequency (from the zero crossing period)
Phase (phase-to-phase) Voltages
Phase (line) currents
Current leakage (ground fault)
Phase active and total powers
Power factor
There are two additional items very useful for every customer, and it is a power demand and the total energy:
Power demand
Total energy
Power demand is an average (like over a 15-minute time period) total/active power consumed by a monitored load. PMD can continuously calculate and remember the highest found value. Such information is very important to your power provider to know the highest (peak) power demand.
Total energy is an accumulated total power over the time of monitoring. You can accumulate and report the total consumed energy or the total active energy or both. While this information can’t be used for the billing purposes (as your PMD would have to be certified for this purpose), it is still useful information for your customer.
However, there are more parameters very useful (even mandatory in some cases) to monitor. In North America, they are known as the American National Standards Institute (ANSI) standards. Here is a list of the most important ANSI parameters (functions), which your PMD could monitor:
ANSI 27 – Under-voltage protection
ANSI 32 – Reverse power protection
ANSI 46 – Negative Ssequence protection
ANSI 50 – Instantaneous over-current protection
ANSI 59 – Over-voltage protection
ANSI 60 – Voltage (current) imbalance protection
ANSI 81U – Under-frequency protection
ANSI 81O – Over-frequency protection
All the information alarms should be reported (and cleared) only if a given parameter is out of (or back to) the “normal” range for a certain time. Don’t report any momentarily detected abnormality, as it could be just a false “glitch” caused by many possible factors. Allow the user to set the alarm thresholds levels and the “debounce” times.
All those parameters can be monitored/measured concurrently on two separated 3-phase grinds. Why would we need to do so? Imagine, your PDM has to facilitate connection of an external 3-phase power generator to the public grid. Then, of course you need to monitor both grids, as the generator can be connected only when all the important parameters of both grids are identical.
And what are those important parameters? At first it is the ANSI 32 – Reverse power protection function/alarm. This alarm is based on the detection of a reverse current flow to the generator, that is, detection of a lower-than-nominal generated power.
The most important addition is the ANSI 25 functionality, which is needed for a generator-grid connection to the public grid. Improper connection of a generator to the main system may result in damage to the generator step-up transformer and damage of any part of a generating unit.
The damage incurred may be slipped couplings, increased shaft vibration, a change in bearing alignment, loosened stator windings, loosened stator laminations and fatigue damage to shafts and other mechanical parts. Just ask an expert.
Your PMD, if used as the generator synchronizer, will have to be responsible for the monitoring three basic conditions, known as:
ANSI 25/1 – Grid-to-grid phase shift
ANSI 25/2 – Grid-to-grid phase voltage difference
ANSI 25/3 – Grid-to-grid frequency difference
If and only if no ANSI alarms are present, and all the ANSI 25 conditions are satisfied, may the external generator be connected to the public grid. How this can be implemented? Figure 8 shows a basic schematic drawing of such a system. It is a relatively complex (multi-parameter) control system, in which PMD plays an important part.
Discussion: Power monitoring principles, challenges, engineering
In this tutorial article, you have learned the power monitoring principles and challenges as well, because, as in any “engineering” task, there is a space for the further improvement. Those improvements can be made on the hardware and on the software side. For example, on the hardware side, a modern digital signal processor (DSP) can easily monitor two power gids. Such a processor, using the single instruction multiple data (SIMD) architecture, allows you to apply the user’s code to two independent data sets. For some simpler applications, an integrated power monitoring device may suffice.
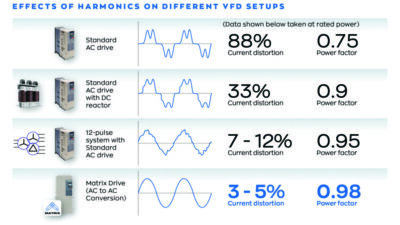
On the software side of such power monitoring devices, there are still few interesting functionalities worth implementing. For example, your PMD could monitor the 3-phase power quality as well. What does it mean? As many powered devices, like motors, transformers are actually non-linear (meaning their impedance is non-linear), the current flowing through them becomes distorted. And the same applies to the secondary voltages. How can such transformer distortion be detected? If you remember the Fourier Transform, you have the answer. It is relatively easy to implement such a spectral analysis of the monitored variables (voltages, currents) using the fast Fourier transform algorithm (FFT). If taking 128 samples from the power cycle, you can calculate up to 64 “harmonics” (actually a dc component plus 63 harmonics), which represent the monitored variable quality. There are devices, which can be used to improve such distortion, but you need to know which harmonic and how much correction is required.
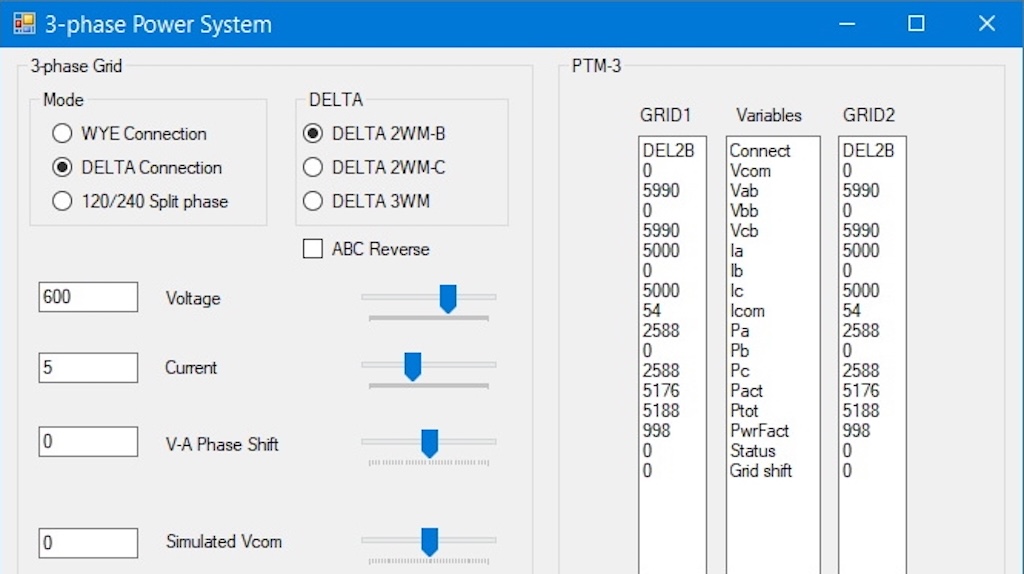
If you are a software designer, you would benefit if you start your PMD S/F (or firmware) design with a suitable simulation. This article uses my simulation system (see Figure 7 and 8). It consists of two applications, one (shown in those pictures) is a graphical user interface (GUI), which allows the user to select the operation mode and all parameters for the simulation and further processing. It receives and displays the reported results. The second application is actually such a simulator – 3-phase signal generator, and, most importantly, the processing application. Its code is written entirely in the C language, so it can be very easily ported to any digital signal (or other) processor. Those two applications communicate through the network socket, which can be again useful for the final PMD implementation as your device needs to communicate with the user and/or other devices.
![Figure 8: Drawing of the PMD used for the external generator connection is shown. [Note: A modern digital signal processor (DSP), like an Analog Devices Sharc processor, can monitor two power grids; using the single instruction multiple data (SIMD) architecture allows you to apply the user’s code to two independent data sets. For some simpler applications, Analog Devices offers integrated power monitoring devices, like ADE9430.] Courtesy: Peter Galan, a retired control software engineer](https://www.controleng.com/wp-content/uploads/2025/01/CTL2502_MAG2_F3_MOTOR-EFF-PowerMonitoring-Fig8-PMD-externalgenerator-connection-754x1024.jpg)
Peter Galan is a retired control system designer and engineer; edited by Mark T. Hoske, editor-in-chief, Control Engineering, WTWH Media, [email protected].
CONSIDER THIS
Are you using best practices and ANSI standards appropriately for power monitoring?
ONLINE
For other Control Engineering tutorial articles from Peter Galan, see the following article and links in it.