Solve the workforce challenge: Automate, innovate, hire and retain great workers. Lack of skilled workers, materials and the economy are biggest threats to manufacturing. Lack of available skilled workers jumped from 37% in 2021 to 57% in 2022.

Learning Objectives
- Learn about key threats to manufacturing from the 2022 Control Engineering Career and Salary Survey.
- Examine skills needed to advance in engineering.
- Compare and benchmark your career progress with peers.
Continuing manufacturing workforce shortages have increased as the biggest threat to manufacturing, jumping to 57% in 2022 as the severest threat, up from 37% in 2021, which may be applying upward pressure on wages and benefits. Reflecting supply chain challenges, “lack of necessary materials” jumped to 42% from 27% in 2021. Energy costs leaped to 20% from 8% in 2021. More engineers expect to receive a salary increase, 67%, compared to 62% in 2021; 26% expect an increase in benefits, compared to 23% in 2021. There were among the findings in the 2022 Control Engineering Career and Salary Survey and Report.
Download the 2022 Control Engineering Career and Salary Survey.
Many respondents work in industries deemed essential, which can create more competition for their talents and upward pressure on wages and benefits. Hours worked in a week in 2022: 11% 39 hours or less (6% in 2021), 43% 40 to 44 hours (42% in 2021), 29% 45 to 49 hours (33% in 2021), 9% 50 to 54 hours (12% in 2021), 3% 55 to 59 hours (1% in 2021), and 5% 60 hours or more (6% in 2021).
One continuing solution to workforce shortages is to automate and more carefully control facility processes and factory automation, as Control Engineering subscribers know. Automation is helping fill the skills gap. In separate, still-unpublished Control Engineering research, “Buying Considerations for Automation Systems and Control Systems,” respondents were given a list of 15 product categories in automation processes; of those, respondents expected to increase in spending in 14 categories in the next 12 months. Among a list of 39 control system categories, respondents expect increases all 39 options in the next 12 months. We’ll have more on this in a subsequent issue.
In the 2022 Control Engineering Career and Salary Survey and Report, most survey respondents feel secure in a manufacturing career (81%), up slightly from 2021 (78%). Two-thirds (67%) love or like their current jobs, with 38% loving their current jobs; 26% like what they do, but they would consider switching companies for the right opportunity.
Subsequent articles in this section provide advice on engineering employee hiring and retention. Articles in every issue of Control Engineering discuss how automation, controls and instrumentation bring greater efficiencies to manufacturing, often in the face of manufacturing workforce shortages.
Survey methods
Research for the 2022 Control Engineering Career and Salary Report resulted from an emailed survey to subscribers, producing 244 qualified responses from April 1 to April 16, 2022, for a margin of error of +/-6.3% at a 95% confidence level. Survey respondents were invited to anonymously provide their annual compensation information and opinions on the current state of their facilities and industries.
Engineering salary increases
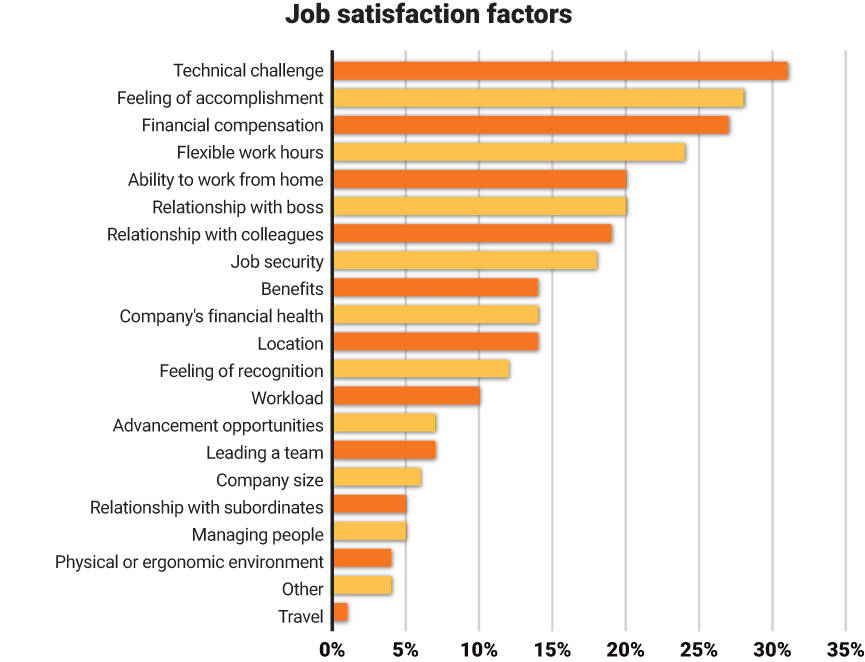
During challenging times, financial compensation can become more important among factors impacting job satisfaction. In 2022, technical challenge (31%), feeling of accomplishment (28%) and financial compensation (27%) finished in a statistical dead heat, within the margin of error.
Supply chain shortages that fuel inflation in turn create upward salary pressures on salary and benefits, coupled with demographic pressures of an aging workforce and too few going into science, technology, engineering, and math (STEM)-related professions.
As Figure 1 shows, 45% expect a salary increase of up to 3% in 2022 (51% in 2021; 52% in 2020; 63% in 2019; 56% in 2018); 12% expect an increase of 4% or more (14% in 2021; 18% in 2020; 11% in 2019; 19% in 2018); 32% expect the same (32% in 2021; 30% in 2020; 25% in 2019; 23% in 2018); and 1% expect a salary decrease (3% in 2021; 1% in 2020 and 2019; 2% in 2018).

Engineering salary, bonus details
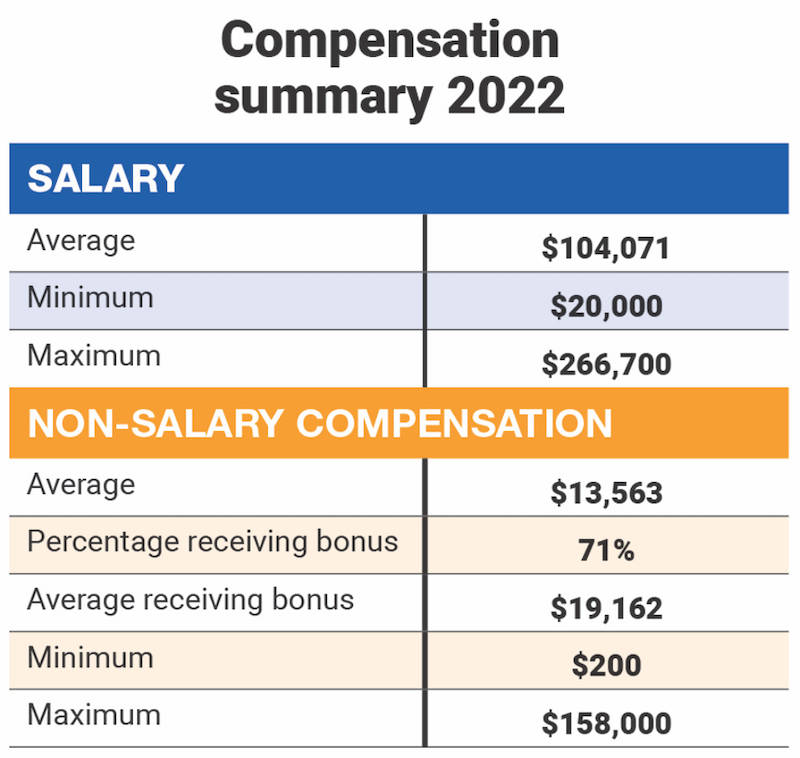
For base salary compensation, the minimum was $20,000 ($28,000 in 2021), and the maximum was $266,700, ($250,000 in 2021), for 244 survey respondents providing this information in 2022.
For non-salary compensation (Figure 2), 26% expect an increase (23% in 2021); 14% expect an increase of 4% or more (12% in 2021); 62% expect about the same (same in 2021); and 12% expect less (15% in 2021).

For non-salary compensation (Figure 3), the 2022 average received was $13,563 compared to $12,838 in 2021 and $11,937 in 2020. Just averaging those who received a bonus, the amount was $19,162.
Engineering bonus criteria
Two leading criteria for non-salary compensation were company profitability at 54% and personal performance at 49% (Figure 4). Much farther down the scale were product profits at 18%, new business/sales 17%, plant or line productivity 16%, quality metrics 16%, safety metrics 13%, reducing plant costs 10% and uptime/downtime at 9%.

Engineering job satisfaction, skills needed
Companies seeking to attract and retain engineering talent should be aware of leading factors that influence job satisfaction for engineers. As mentioned, the leading job satisfaction factors in 2022 (Figure 5) are technical challenge, feeling of accomplishment and financial compensation in a statistical tie. (Respondents were asked to rank the top three.)
Respondents in 2022 have different preferences. Going down the list in rank order (2022, 2021 ranking in parentheses), other attributes included flexible work hours (4, 5), ability to work from home (5, 7), relationship with boss (6, 8), relationship with colleagues (7, 10), job security (8, 4), benefits (9, 6), company financial health (10, 18), location (11, 12), feeling of recognition (12, 9), and workload (13, 13). Figure 5 shows eight more factors for job satisfaction.
For skills needed to get ahead, respondents were asked to check as many as apply. Engineering skills jumped to a solid lead at 77%, followed by project management skills (63%) and communications/presentation skills (60%) and computer skills (58%) all virtually tied for second. In 2021, engineering skills, project management skills and communication/presentation skills were in a virtual tie for first among respondents. In the 2022 results, team building skills was next at 44%. Considerably lower were language skills (21%), marketing/sales skills (16%), finance/accounting skills (14%) and recruitment skills (10%). See this graphic is in the next article, highlighting career advice from survey respondents.
As mentioned, top three perceived threats to manufacturing are lack of available skills, lack of necessary materials and economy and energy cost (Figure 6). These are followed by inadequate management, competition, government/political interference, regulation codes standards and taxes and tariffs.

Next article in this section also offers threats to manufacturing.
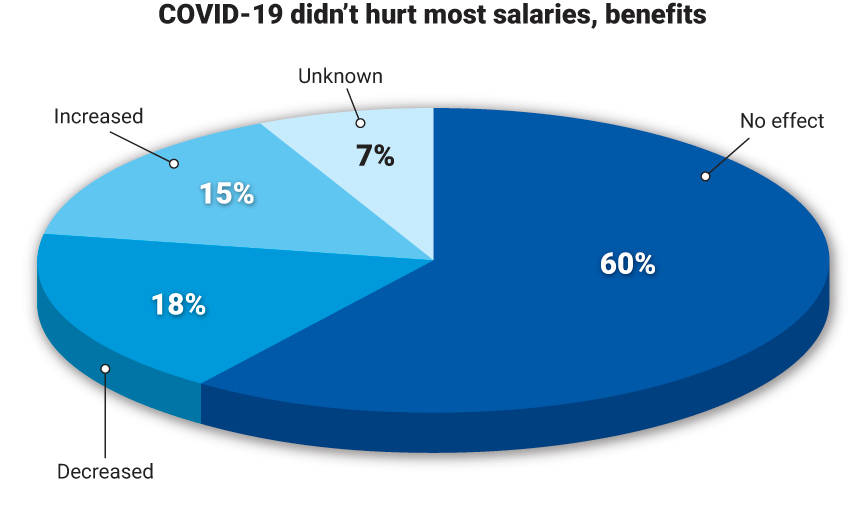
While COVID-19 has impacted supply chain economics, 60% of survey respondents didn’t perceive change to salary and benefits as a result; 18% thought the pandemic decreased salary and benefits; 15% thought they saw an increase; 7% didn’t know.
Age, years at work, education
Demographics help put statistics in context. It’s good to know how these results from subscribers taking the survey relate to the reader. Online tables provide extra context. Industries reliant on automation, controls and instrumentation will need to make things easier to learn, implement, us, and optimize for younger workers as older and more experienced workers retire.
Among those taking the survey, 42% were 60 and older, 33% 50 to 59 years of age, 16% 40 to 49 years of age, 7% 30 to 39 years of age, 1% under 30 years of age and 1% would prefer not to say.
Years working for current employer, 43% 9 years or less, 26% 10 to 19 years, 18% 20 to 29 years and 13% were 30 or more years.
Highest level of education completed: 2% high school diploma, 6% trade/technical school diploma, 8% associate’s degree, 9% college attendance, 48% had a bachelor’s degree, 23% master’s degree, 2% dual bachelor’s degrees, and 2% doctoral degree.
Years in current industry: 9% 9 or fewer years, 12% 10 to 19 years, 21% 20 to 29 years, and half 30 years or more.
Mark T. Hoske is content manager, Control Engineering, CFE Media and Technology, [email protected]. Amanda Pelliccione, director of research and awards programs for CFE Media and Technology, conducted the research and assembled the related report.
– – – – – – – – – – – – – – – – – – – – – – – – – – – – –
The Control Engineering 2022 Career and Salary Report is sponsored by CFE Media and Technology.
– – – – – – – – – – – – – – – – – – – – – – – – – – – – –
ONLINE extra
2022 Control Engineering Career and Salary Survey and Report
BENCHMARKING SECTION: See how your salary compares by these criteria: Age, education, years with current employer, years in current industry, hours worked, facility size, employees managed and primary job function.


MORE ANSWERS
For more information, see this article online and download the Control Engineering 2022 Career and Salary Report.
CONSIDER THIS
See related articles offering advices on:
Advancement skills and threats
How to get ahead in engineering
How to hire and retain engineers
Job training for success in manufacturing
KEYWORDS: 2022 salary survey, career advice