Workforce Development

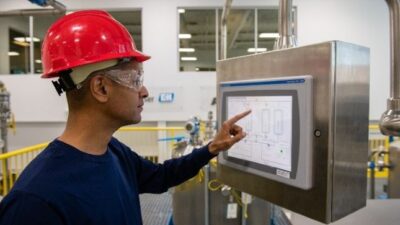
Workforce development refers to training, in-person or online, to teach employees rules, processes and behaviors required to do their jobs. Digital twins and augmented reality and virtual reality can be used to provide learning or guidance in real time.

Workforce Development Articles

Control Engineering Career and Salary Survey, 2022

Solve the workforce challenge: Automate, innovate, hire and retain great workers. Lack of skilled workers, materials and the economy are biggest threats to manufacturing. Lack of available skilled workers jumped from 37% in 2021 to 57% in 2022.


Learning Objectives

  • Learn about key threats to manufacturing from the 2022 Control Engineering Career and Salary Survey.
  • Examine skills needed to advance in engineering.
  • Compare and benchmark your career progress with peers.

Continuing manufacturing workforce shortages have increased as the biggest threat to manufacturing, jumping to 57% in 2022 as the severest threat, up from 37% in 2021, which may be applying upward pressure on wages and benefits. Reflecting supply chain challenges, “lack of necessary materials” jumped to 42% from 27% in 2021. Energy costs leaped to 20% from 8% in 2021. More engineers expect to receive a salary increase, 67%, compared to 62% in 2021; 26% expect an increase in benefits, compared to 23% in 2021. There were among the findings in the 2022 Control Engineering Career and Salary Survey and Report.

Download the 2022 Control Engineering Career and Salary Survey.

Many respondents work in industries deemed essential, which can create more competition for their talents and upward pressure on wages and benefits. Hours worked in a week in 2022: 11% 39 hours or less (6% in 2021), 43% 40 to 44 hours (42% in 2021), 29% 45 to 49 hours (33% in 2021), 9% 50 to 54 hours (12% in 2021), 3% 55 to 59 hours (1% in 2021), and 5% 60 hours or more (6% in 2021).

One continuing solution to workforce shortages is to automate and more carefully control facility processes and factory automation, as Control Engineering subscribers know. Automation is helping fill the skills gap. In separate, still-unpublished Control Engineering research, “Buying Considerations for Automation Systems and Control Systems,” respondents were given a list of 15 product categories in automation processes; of those, respondents expected to increase in spending in 14 categories in the next 12 months. Among a list of 39 control system categories, respondents expect increases all 39 options in the next 12 months. We’ll have more on this in a subsequent issue.

In the 2022 Control Engineering Career and Salary Survey and Report, most survey respondents feel secure in a manufacturing career (81%), up slightly from 2021 (78%). Two-thirds (67%) love or like their current jobs, with 38% loving their current jobs; 26% like what they do, but they would consider switching companies for the right opportunity.

Subsequent articles in this section provide advice on engineering employee hiring and retention. Articles in every issue of Control Engineering discuss how automation, controls and instrumentation bring greater efficiencies to manufacturing, often in the face of manufacturing workforce shortages.

Survey methods

Research for the 2022 Control Engineering Career and Salary Report resulted from an emailed survey to subscribers, producing 244 qualified responses from April 1 to April 16, 2022, for a margin of error of +/-6.3% at a 95% confidence level. Survey respondents were invited to anonymously provide their annual compensation information and opinions on the current state of their facilities and industries.

Engineering salary increases

During challenging times, financial compensation can become more important among factors impacting job satisfaction. In 2022, technical challenge (31%), feeling of accomplishment (28%) and financial compensation (27%) finished in a statistical dead heat, within the margin of error.

Supply chain shortages that fuel inflation in turn create upward salary pressures on salary and benefits, coupled with demographic pressures of an aging workforce and too few going into science, technology, engineering, and math (STEM)-related professions.

As Figure 1 shows, 45% expect a salary increase of up to 3% in 2022 (51% in 2021; 52% in 2020; 63% in 2019; 56% in 2018); 12% expect an increase of 4% or more (14% in 2021; 18% in 2020; 11% in 2019; 19% in 2018); 32% expect the same (32% in 2021; 30% in 2020; 25% in 2019; 23% in 2018); and 1% expect a salary decrease (3% in 2021; 1% in 2020 and 2019; 2% in 2018).

Figure 1: Two-thirds of respondents expect a salary increase in 2022. Courtesy: Control Engineering research, CFE Media and CFE Technology Figure 1: Two-thirds of respondents expect a salary increase in 2022. Courtesy: Control Engineering research, CFE Media and CFE Technology

Engineering salary, bonus details

For base salary compensation, the minimum was $20,000 ($28,000 in 2021), and the maximum was $266,700, ($250,000 in 2021), for 244 survey respondents providing this information in 2022.

For non-salary compensation (Figure 2), 26% expect an increase (23% in 2021); 14% expect an increase of 4% or more (12% in 2021); 62% expect about the same (same in 2021); and 12% expect less (15% in 2021).

Figure 2: 26% of respondents expect an increase in 2022 non-salary compensation. Courtesy: Control Engineering research, CFE Media and CFE Technology Figure 2: 26% of respondents expect an increase in 2022 non-salary compensation. Courtesy: Control Engineering research, CFE Media and CFE Technology

For non-salary compensation (Figure 3), the 2022 average received was $13,563 compared to $12,838 in 2021 and $11,937 in 2020. Just averaging those who received a bonus, the amount was $19,162.

Figure 3: In 2022, the average salary of respondents is $104,071, down from $108,096 in 2021. In 2022, average non-salary compensation is $13,563, up from $12,838 in 2021. Courtesy: Control Engineering research, CFE Media and CFE Technology Figure 3: In 2022, the average salary of respondents is $104,071, down from $108,096 in 2021. In 2022, average non-salary compensation is $13,563, up from $12,838 in 2021. Courtesy: Control Engineering research, CFE Media and CFE Technology

Engineering bonus criteria

Two leading criteria for non-salary compensation were company profitability at 54% and personal performance at 49% (Figure 4). Much farther down the scale were product profits at 18%, new business/sales 17%, plant or line productivity 16%, quality metrics 16%, safety metrics 13%, reducing plant costs 10% and uptime/downtime at 9%.

Figure 4: In 2022, company profits jumped ahead of personal performance as the leading criteria for non-salary compensation, after being tied in 2021. Courtesy: Control Engineering research, CFE Media and CFE Technology Figure 4: In 2022, company profits jumped ahead of personal performance as the leading criteria for non-salary compensation, after being tied in 2021. Courtesy: Control Engineering research, CFE Media and CFE Technology

Engineering job satisfaction, skills needed

Companies seeking to attract and retain engineering talent should be aware of leading factors that influence job satisfaction for engineers. As mentioned, the leading job satisfaction factors in 2022 (Figure 5) are technical challenge, feeling of accomplishment and financial compensation in a statistical tie. (Respondents were asked to rank the top three.)

Respondents in 2022 have different preferences. Going down the list in rank order (2022, 2021 ranking in parentheses), other attributes included flexible work hours (4, 5), ability to work from home (5, 7), relationship with boss (6, 8), relationship with colleagues (7, 10), job security (8, 4), benefits (9, 6), company financial health (10, 18), location (11, 12), feeling of recognition (12, 9), and workload (13, 13). Figure 5 shows eight more factors for job satisfaction.

Figure 5: Top factors for job satisfaction are technical challenge, feeling of accomplishment and financial compensation. Courtesy: Control Engineering research, CFE Media and CFE Technology Figure 5: Top factors for job satisfaction are technical challenge, feeling of accomplishment and financial compensation. Courtesy: Control Engineering research, CFE Media and CFE Technology

For skills needed to get ahead, respondents were asked to check as many as apply. Engineering skills jumped to a solid lead at 77%, followed by project management skills (63%) and communications/presentation skills (60%) and computer skills (58%) all virtually tied for second. In 2021, engineering skills, project management skills and communication/presentation skills were in a virtual tie for first among respondents. In the 2022 results, team building skills was next at 44%. Considerably lower were language skills (21%), marketing/sales skills (16%), finance/accounting skills (14%) and recruitment skills (10%). See this graphic is in the next article, highlighting career advice from survey respondents.

As mentioned, top three perceived threats to manufacturing are lack of available skills, lack of necessary materials and economy and energy cost (Figure 6). These are followed by inadequate management, competition, government/political interference, regulation codes standards and taxes and tariffs.

Figure 6: Lack of available skilled workers, lack of necessary materials, and economy are leading perceived threats to manufacturing. Courtesy: Control Engineering research, CFE Media and CFE Technology Figure 6: Lack of available skilled workers, lack of necessary materials, and economy are leading perceived threats to manufacturing. Courtesy: Control Engineering research, CFE Media and CFE Technology

Next article in this section also offers threats to manufacturing.

While COVID-19 has impacted supply chain economics, 60% of survey respondents didn’t perceive change to salary and benefits as a result; 18% thought the pandemic decreased salary and benefits; 15% thought they saw an increase; 7% didn’t know.

Figure 7: 15% think the pandemic increased their salary and benefits, up from 7% in 2021. Most (60%) didn’t think there was an effect. Courtesy: Control Engineering research, CFE Media and CFE Technology Figure 7: 15% think the pandemic increased their salary and benefits, up from 7% in 2021. Most (60%) didn’t think there was an effect. Courtesy: Control Engineering research, CFE Media and CFE Technology

Age, years at work, education

Demographics help put statistics in context. It’s good to know how these results from subscribers taking the survey relate to the reader. Online tables provide extra context. Industries reliant on automation, controls and instrumentation will need to make things easier to learn, implement, us, and optimize for younger workers as older and more experienced workers retire.

Among those taking the survey, 42% were 60 and older, 33% 50 to 59 years of age, 16% 40 to 49 years of age, 7% 30 to 39 years of age, 1% under 30 years of age and 1% would prefer not to say.

Years working for current employer, 43% 9 years or less, 26% 10 to 19 years, 18% 20 to 29 years and 13% were 30 or more years.

Highest level of education completed: 2% high school diploma, 6% trade/technical school diploma, 8% associate’s degree, 9% college attendance, 48% had a bachelor’s degree, 23% master’s degree, 2% dual bachelor’s degrees, and 2% doctoral degree.

Years in current industry: 9% 9 or fewer years, 12% 10 to 19 years, 21% 20 to 29 years, and half 30 years or more.

Mark T. Hoske is content manager, Control Engineering, CFE Media and Technology, mhoske@cfemedia.com. Amanda Pelliccione, director of research and awards programs for CFE Media and Technology, conducted the research and assembled the related report.

– – – – – – – – – – – – – – – – – – – – – – – – – – – – –

The Control Engineering 2022 Career and Salary Report is sponsored by CFE Media and Technology.

– – – – – – – – – – – – – – – – – – – – – – – – – – – – –

ONLINE extra

2022 Control Engineering Career and Salary Survey and Report

BENCHMARKING SECTION: See how your salary compares by these criteria: Age, education, years with current employer, years in current industry, hours worked, facility size, employees managed and primary job function.

Figure 8: Age and compensation: Among respondents to the 2022 Control Engineering Career and Salary Survey and Report: The older you are the more you receive in salary and non-salary compensation. Courtesy: Control Engineering research, CFE Media and CFE Technology Figure 8: Age and compensation: Among respondents to the 2022 Control Engineering Career and Salary Survey and Report: The older you are the more you receive in salary and non-salary compensation. Courtesy: Control Engineering research, CFE Media and CFE Technology Figure 9: Education and compensation in the 2022 Control Engineering Career and Salary Survey and Report: More education generally results in higher compensation, though not always. Courtesy: Control Engineering research, CFE Media and CFE Technology Figure 9: Education and compensation in the 2022 Control Engineering Career and Salary Survey and Report: More education generally results in higher compensation, though not always. Courtesy: Control Engineering research, CFE Media and CFE Technology Figure 10: Years with current employer and compensation in the 2022 Control Engineering Career and Salary Survey and Report: Compensation amounts generally increase in time, though not always. Courtesy: Control Engineering research, CFE Media and CFE Technology Figure 10: Years with current employer and compensation in the 2022 Control Engineering Career and Salary Survey and Report: Compensation amounts generally increase in time, though not always. Courtesy: Control Engineering research, CFE Media and CFE Technology Figure 11: Years in current industry and compensation has considerable variance, perhaps related to staff retention and competition for talent, in the 2022 Control Engineering Career and Salary Survey and Report. Courtesy: Control Engineering research, CFE Media and CFE Technology Figure 11: Years in current industry and compensation has considerable variance, perhaps related to staff retention and competition for talent, in the 2022 Control Engineering Career and Salary Survey and Report. Courtesy: Control Engineering research, CFE Media and CFE Technology Figure 12: Hours worked per week and compensation: There’s not a lot of base salary correlation, but non-salary compensation increases with hours worked according to respondents to the 2022 Control Engineering Career and Salary Survey and Report. Courtesy: Control Engineering research, CFE Media and CFE Technology Figure 12: Hours worked per week and compensation: There’s not a lot of base salary correlation, but non-salary compensation increases with hours worked according to respondents to the 2022 Control Engineering Career and Salary Survey and Report. Courtesy: Control Engineering research, CFE Media and CFE Technology Figure 13: Primary job function and compensation: highest was general or corporate management for engineering for base salary; non-salary compensation was highest for sales engineering in the 2022 Control Engineering Career and Salary Survey and Report. Courtesy: Control Engineering research, CFE Media and CFE Technology Figure 13: Primary job function and compensation: highest was general or corporate management for engineering for base salary; non-salary compensation was highest for sales engineering in the 2022 Control Engineering Career and Salary Survey and Report. Courtesy: Control Engineering research, CFE Media and CFE Technology Figure 14: Number of employees managed and compensation: Base salary varies, but was highest when over 100 employees are managed; non-salary compensation increased steadily by number of employees managed according to the 2022 Control Engineering Career and Salary Survey and Report. Courtesy: Control Engineering research, CFE Media and CFE Technology Figure 14: Number of employees managed and compensation: Base salary varies, but was highest when over 100 employees are managed; non-salary compensation increased steadily by number of employees managed according to the 2022 Control Engineering Career and Salary Survey and Report. Courtesy: Control Engineering research, CFE Media and CFE Technology Figure 15: Facility size and compensation peaks at 250-499 employees in base salary and non-salary compensation in the 2022 Control Engineering Career and Salary Survey and Report. Courtesy: Control Engineering research, CFE Media and CFE Technology Figure 15: Facility size and compensation peaks at 250-499 employees in base salary and non-salary compensation in the 2022 Control Engineering Career and Salary Survey and Report. Courtesy: Control Engineering research, CFE Media and CFE Technology

MORE ANSWERS

For more information, see this article online and download the Control Engineering 2022 Career and Salary Report.

CONSIDER THIS

See related articles offering advices on:

Advancement skills and threats

How to get ahead in engineering

How to hire and retain engineers

Job training for success in manufacturing

KEYWORDS: 2022 salary survey, career advice

Workforce Development FAQ

  • What are workforce development strategies?

    Workforce development strategies are methods for improving the skills and knowledge of employees, preparing them for new roles, and building a skilled and productive workforce. This can include training programs, career development opportunities, succession planning, recruitment, employee retention, flexible work arrangements and employee engagement. Additionally, upskilling and reskilling and diversity and inclusion also are considered as important strategies. These strategies help organizations to improve performance, increase competitiveness and create a positive work culture.

  • What will a workforce development plan include?

    A workforce development plan typically includes objectives, goals and strategies to improve the skills and knowledge of employees, and prepare them for new roles and responsibilities or review existing or new skills for current roles. It may also include a budget, timelines and performance metrics to track progress and evaluate the effectiveness of the plan. The plan also may include specific actions such as training programs, career development opportunities, recruitment, employee retention, flexible work arrangements and employee engagement.

  • What is an example of workforce development?

    An example of workforce development could be a manufacturing company offering in-house or online training programs to teach employees how to operate new machinery or use new software. This training is focused on equipping employees with the necessary skills to perform their current job more effectively and efficiently, and it may prepare them for new roles or responsibilities in the future. The company may also implement a mentorship program that pairs experienced employees with newer hires to provide on-the-job training and guidance.

  • What is automation training?

    Automation training refers to the process of educating and training individuals on how to operate, maintain and troubleshoot automated systems and equipment. Automation can encompass a wide range of technologies, including programmable logic controllers (PLCs), robotics and industrial control systems (ICS). Automation training can include theoretical and practical components, with a focus on hands-on learning, allowing individuals to gain the knowledge and skills needed to work with these systems in a safe and efficient manner. The training can include topics such as programming, system design, troubleshooting and maintenance, and it can be provided in a variety of formats such as classroom-based instruction, online courses and on-the-job training.

Some FAQ content was compiled with the assistance of ChatGPT. Due to the limitations of AI tools, all content was edited and reviewed by our content team.