Advanced process controls (APC) requires appropriate metrics, or key performance indicators (KPIs) to ensure safe, efficient operations. Alarms, relief valves, safety systems and APC need monitoring. Learn five good APC metrics, the missing metric and four recommended practices for APC metrics.
Learning Objectives
- Examine five characteristics of a “good” APC metric for optimization and industry’s missing APC metric.
- Understand APC service factor and some APC history to understand current needs.
- Learn four recommended practices for APC metrics.
Metrics, also known as key performance indicators (KPIs), are an essential tool to achieve safe and efficient process operations. Metrics indicate if key aspects of operation, such as alarms, relief valves, safety systems or advanced process controls (APC) are functioning in a healthy manner as intended, or if systemic breakages have occurred that need attention.
It is expensive to maintain large staffs of specialists to oversee healthy performance of various technologies throughout a large company. Instead, companies keep optimized (that is, minimal) staffs of support specialists and use metrics to manage and prioritize their activities. In this way, metrics provide an essential tool to manage many key aspects of process operation with limited resources.
In the case of APC, a company may have dozens or hundreds of APC applications throughout the enterprise, but a limited number of APC specialists. APC metrics provide essential information in order to know when, where and how to allocate these limited support resources. This management strategy is only as sound as the metrics that drive it.
Five characteristics of a “good” metric for APC optimization
in the same way alarm rationalization at one point took a step back to ask, exactly what are the characteristics of a “good” alarm?(1), it is worth asking, what are the characteristics of a “good” metric?
- Transparent, meaningful and intuitive; has the confidence of all operation and optimization stakeholders, not just the APC specialists
- Automated, timely, responsive and reliable; can be seen to respond correctly and in a timely manner to observed changes in APC status or behavior
- Technology independent; can be applied to any type of APC or advanced regulatory control (ARC), while also providing useful “apples to apples” comparisons between applications
- Captures untapped opportunity; indicates if the technology has been applied everywhere it should be, shows long-term progress, and how much deployment potential remains
- Elegant and efficient; comprises a minimum number of relatively simple, automated, low-maintenance metrics, that can be deployed uniformly throughout an enterprise.
Metrics don’t necessarily diagnose the root cause of a breakage, but they should reflect the ill effect(s) of any system breakdown regardless of the root cause. For example, blood pressure and pulse don’t diagnose medical conditions, but they provide an indication of patient health,the need for routine maintenance or the need for more specialized treatment.
APC service factor meaning, history
APC has never enjoyed such good metrics. APC has relied on a single limited metric “service factor,” which is the percentage of time an APC application is on or off. Unfortunately, it is possible, even common, for applications to remain on, but have a very “degraded” performance. Service factor remains important to indicate when an APC application has been turned off, but a high service factor cannot be taken to mean the application is healthy and serving its intended purpose.
Attempts at more telling metrics have been generally unsuccessful for fundamentally the same reason that has always complicated conventional model-based APC performance. It is a conundrum to achieve reliable model-based multivariable control performance or measure that performance in a meaningful way, if the underlying models themselves are unreliable
(2).
Most large users of conventional APC technology have, after so many decades, improvised various in-house APC metric tools, but none of them meet the “good metric” criteria and no industry best practice has emerged.
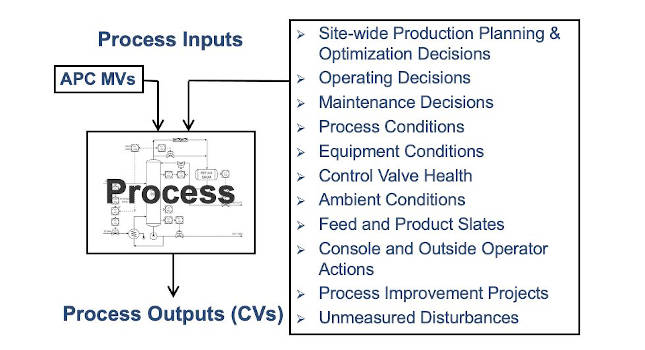
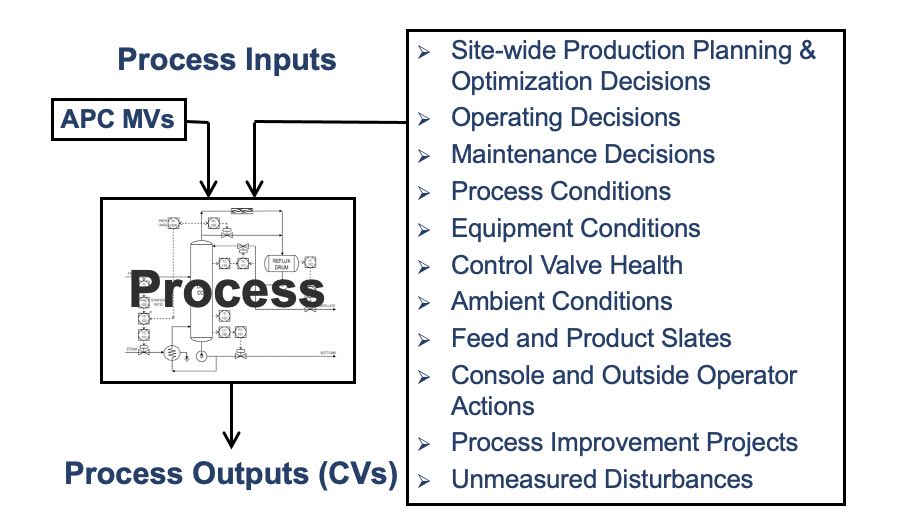
A misstep of APC metrics in the past has been the nearly universal assumption to base them on controlled variable (CV) performance, rather than on manipulated variable (MV) movement. The basic problem is CV performance is subject to many factors aside from the APC application (Figure 1). Most modern process operation environments are dynamic with many ongoing parallel efforts to optimize key CVs by various means, so it is practically impossible to isolate the individual contribution of APC. That is why a plant step used in the first place – because individual effects cannot be isolated from overall CV behavior during normal operation. Conversely, MV movement provides a clean record of the contribution of the APC application that can serve as the basis for “good” APC metrics.
Industry’s missing APC metric
Industry took to heart the intrinsic value of closed-loop control over open-loop control long ago, so “loops in manual” is one of the most common process control metrics today. Industry also took to heart the idea that console operators should not be distracted or overwhelmed by excessive numbers of low-value alarms, so that “bad actor alarms” became another nearly universal metric.
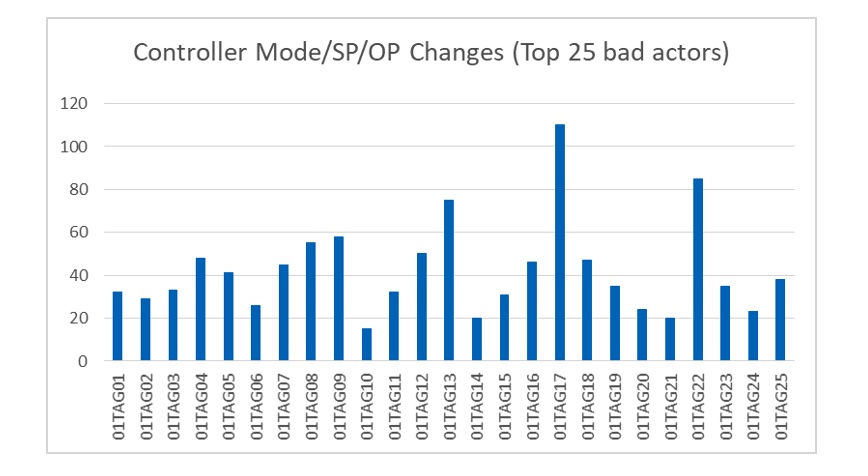
This says a lot about the number of loop interventions (such as the number of controller setpoint, output and mode changes) that occur at an operations console. High numbers indicate excessive multivariable loops in manual and/or bad actor loops. Such a “loop intervention” metric embodies a wealth of APC measurement and management information. It measures the activity load on console operators; indicates the health of existing multivariable control applications; identifies missing/needed applications; and identifies top bad actor loops. The total number of loop interventions measures overall APC program effectiveness, progress, and remaining APC potential.
Industry today has an “alarms per hour” best practice guideline for effective operation. Shouldn’t industry also have a “loop interventions per hour” guideline? APC, after base-layer health, is the primary tool to bring high numbers down to an acceptable (operable) number.
Four recommended practices for APC metrics
The following suite of APC metrics meet “good metric” criteria and can be used to achieve effective monitoring and management of APC technology programs:
- Service factor (see above limitations)
- MV utilization (based on MV movement)
- MV benefits (optionally, MV movement can also be translated into actual dollar benefits)
- Loop interventions, also known as bad actor Loops (identifies individual MV health, overall APC effectiveness and progress, and remaining uncaptured APC opportunity).
Allan Kern is president, APC Performance LLC. Edited by Mark T. Hoske, content manager, Control Engineering, CFE Media, [email protected].
KEYWORDS
Advanced process control, APC, metrics
LEARNING OBJECTIVES
CONSIDER THIS
How advanced is your advance process controls without the right metrics?
REFERENCES
- EEMUA 191 Alarm systems: Guide to design, management and procurement, Table 1: Characteristics of a good alarm
- APC maintenance scheduling—Part 1, Hydrocarbon Processing, February 2020, Mayo, S. M., Rhinehart, R. R., Madihally, S. V.