Case-use examples illustrate the point
In the year 2020 discussing overall equipment effectiveness (OEE) seems a little out of date. Whatever it’s called — OEE, downtime reporting or asset utilization — it’s not a new topic. It might also have scenario-specific names like clean in place (CIP), a variation on a theme: how to quickly cycle a process and return assets to availability.
Articles a decade or two old describe how to calculate OEE or measure asset downtime. It’s been a foundation of Lean or Six Sigma methodologies for years. So, what has it to do with the Industrial Internet of Things (IIoT) and analytics?
Use of OEE as a metric and OEE results improve with IIoT and advanced analytics.
First comes relief from years of misery mired in spreadsheets investigating downtime issues. Second, significant savings arise from insights uncovered on downtime analytics. Finally, accelerated decision making and taking action leads to business transformation. These substantial benefits reinforce both the importance of downtime reporting and the opportunities to improve it.
But before we look at success stories, let’s take a deeper dive into downtime reporting and OEE.
Downtime is descriptive
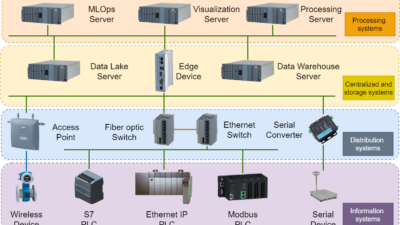
Downtime reporting is an example of “descriptive analytics” because it describes what happened, a term associated with reports and data visualization: static and historic. Even if the reports are updated periodically, often using a dashboard, they are still descriptive analytics. Although the numbers may not be static, the calculations and parameters (fault codes, measurements, etc.) are fixed at the point of design (Figure 1).
Therefore, descriptive analytics is considered basic. It defines what is looked for, defines calculations in advance and then measures and presents in past or present form. But as we all know, things are always changing in industrial plants and facilities, with various factors laying waste to the best laid plans. As Helmuth van Moltken famously said back in 1880, “No plan of operations reaches with any certainty beyond the first encounter with the enemy’s main force.”
The enemy here is change and its potential negative effects on OEE, downtime and asset utilization. The fact that downtime reporting is based on a calculation determined in advance of plant operations means that as soon as something interesting happens — as soon as there is an encounter with the enemy — then the report’s value as a picture of the past rapidly decreases.
A new approach is therefore required to deal with the enemy, with process engineers leading the charge.
Engineers into the breach
When insight is needed to solve an unknown issue — for example to figure out what happened that wasn’t expected, why the metric is below plan or to understand causation — then downtime analysis is required, along with a subject matter expert such as a process engineer. This approach puts process engineers where they should be, at the frontlines of insight and with advanced analytics they have a solution that is radically faster than the spreadsheet approach.
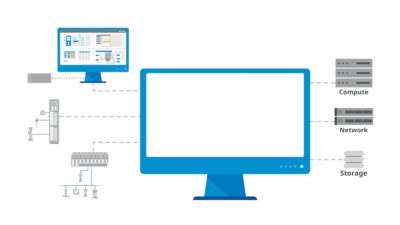
In analytics terms, what has happened is a transition from descriptive analytics to diagnostic analytics (Figure 2). If descriptive analytics is a report, diagnostic analytics is interactive investigation and discovery, in some cases a root-cause analysis. Diagnostic analytics is how cause is determined and correlations found, and it can include discoveries of best practices and comparisons. All these insights are arrived at very quickly by leveraging computer science innovations (big data, machine learning, etc.) that enable the “advanced” in advanced analytics applications.
Diagnostics in action
To take one example, when drying different products, to identify the optimum endpoint, it is important to understand the impact of various parameters on drying time. According to Dr. Robert Forest, a development engineer with Bristol-Myers Squibb (BMS), the fundamental question is: “How long should we dry the wet cake to meet our drying endpoint?” If the product is dried for too long, it increases cycle times unnecessarily. But if the product is not dried long enough, it could fail the process control sample, which is a waste of analytic resources.
Prior to using Seeq, BMS collected many different data points from the OSIsoft PI tag data, using a simple summary of the statistics to help determine drying times. The company would review the minimum, maximum and average product temperatures; agitator speed; jacket temperature; and drying time. BMS would then compare these data points to the actual solvent loss measured by taking samples throughout the drying process. Manually collecting the data was tedious, time-consuming and error-prone, so BMS needed a more automated way to collect and analyze these data.
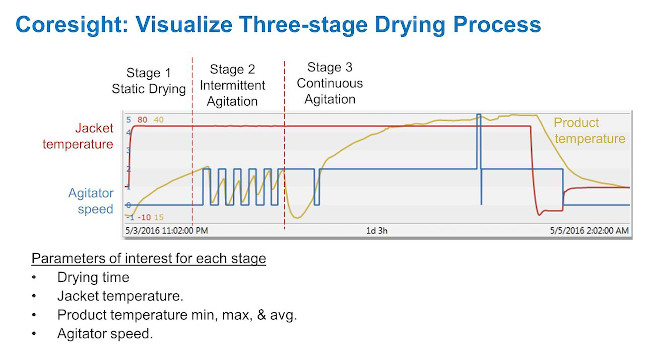
The typical filter drying process goes through three distinct drying process stages (Figure 3). Stage 1 (static drying) starts out by heating without agitation. Stage 2 continues to heat, but with intermittent agitation. In stage 3, heating continues with continuous agitation. BMS wanted to identify some of the key parameters for each drying stage to optimize drying for a range of different batches. To do this, the company needed to automatically find when the dryer was operating by associating the drying phase with the drying time, jacket temperature, product temperature (maximum, minimum and average) and agitator speed.
The next step was to separate the operations data by the distinct drying stages. For stage 1, where there is no agitation, Seeq was used to find the needed data by simply searching for periods of time when the agitator was turned off for extended time periods (rather than intermittently) and combining these data with search results with a high jacket temperature (to indicate that the dryer was operating).
To find the summary data for stage 3, search was set up to first find those periods of time when the agitator was turned on for an extended period, and then combine these with high jacket temperatures. Identifying the parameters for stage 2 was a little trickier because the agitator is turned on and off intermittently, so there is no constant signal value upon which to base the search.
To find stage 2 data, BMS uses the system’s pattern-searching capability to find all batches in which stage 2 agitator on/off behavior is displayed. Seeq enables BMS to create a pattern search for the square waveform of the agitator intermittently cycling on and off. This pattern search allows the user to specify a similarity heuristic to hone the search results. It also enables the users to combine the pattern search results with the jacket temperature. With the combined results, BMS could exclude periods of time before drying actually started, i.e., stage 2.
As illustrated above, Dr. Forest’s team at BMS, in their journey of diagnostic discovery, was able in particular to separate the data into all three stages and automatically calculate the needed statistics. According to Dr. Forest, the ability to use Seeq to search by specific data and overlay batches reduced the time needed to collect the data and saved on average one hour of analysis time per batch.
Sharing results
Using advanced analytics, as insights are found they can be published to colleagues as web pages, PDF documents or updated images. Engineers using advanced analytics thus have an integrated approach to both diagnostic (investigation) and descriptive (publishing) analytics.
Of course, integrated investigation and publishing is a benefit as compared to using two different tools, but just as important is the fact that engineers can create, publish and update the analytics — without any required intervention from IT personnel or specialists.
Unlike traditional OEE reports which are set up by IT departments or plant administrators based on a design that can drift away from plan (new assets, new recipes, new season, new raw materials, etc.), advanced analytics enables the front-line process engineer to quickly iterate the underlying calculations and source data as necessary to represent current plant conditions and associated opportunities. The investigation is faster, publishing is integrated and usage is self-service for the employee closest to the process or asset.
Predicting the future
Process engineers take the next step in their efforts by incorporating predictive analytics (Figure 4). Predictive analytics completes the range of data from historical (diagnostic) and present (descriptive) to what is expected to happen. Instead of an unplanned downtime event, engineers can avert downtime with an early warning system that provides anything from hours to weeks of advanced notice, depending on the process, the data and the engineer’s expertise.
For customers interested in moving from scheduled to predictive maintenance, for example, the ability to evaluate when maintenance is required and what parts to order is critical. The goal isn’t to measure the history of asset failure in downtime or OEE reports, but rather to avoid unnecessary downtime to the greatest extent possible.
Fixed bed catalyst prediction
The challenge for this refinery was to optimize near- and long-term economics by predicting end-of-run for a fixed-bed catalyst system. This required selection and examination of historical data for training the correlations, which were auto-updated as new data became available. Another challenge was to provide insights to enable collaborative analysis and investigation between the refinery licensor and the catalyst vendor.
The solution was to use Seeq formulas to implement first-principles equations to calculate normalized weighted average bed temperature (WABT) for the fixed-bed reactor system. The next step was to normalize WABT for feed rate, feed and product quality, treat gas ratio and so forth. Seeq prediction features were then used to create a model to predict normalized WABT as a function of time within steady state conditions. This enabled the refinery to determine the end-of-run date versus the known WABT performance threshold, and to apply this methodology to their other fixed-bed catalyst processes.
Benefits included monitoring of catalyst deactivation to allow co-optimization of near-term economics and risk-based maintenance planning. Better prediction of end-of-run allowed more effective analysis of the tradeoff between rate reduction and maintenance costs. Calculation of end-of-life for the catalyst enabled rapid detection of unexpected changes and performance of corrective actions.
Final words
Diagnostic, descriptive and predictive analytics can be performed on existing data from SCADA, historian and other manufacturing data sets — and there’s one more form of analytics. Unlike the other terms, this last analytics type doesn’t have an established name, but is the ultimate objective of all analytics: do the right thing.
Yes, it sounds silly, but engineers using Seeq have been emphatic on their enthusiasm for its effectiveness for quickly figuring out the right thing to do to improve operations. In the past, the time to insight in a spreadsheet was ominously long and the work was onerous, so they simply were not able to do the necessary calculations in time to impact and improve production outcomes.
But with Seeq applications, days and weeks become minutes and hours, enabling analytics over time to make a difference, consider tradeoffs and optimize for the big picture.
Downtime reporting and its variants like OEE are not a new concept. They are a staple of every operations playbook. But that doesn’t mean there isn’t an opportunity for a fresh look at the potential of advanced analytics applications to improve all types of analytics.
This article appears in the IIoT for Engineers supplement for Control Engineering and Plant Engineering. See other articles from the supplement below.