Using the cloud for data logging and remote access can improve operations, cut costs and simplify interactions.
Implementing cloud-based remote access is often the first step to implementing Industrial Internet of Things (IIoT) and Industrie 4.0 applications for improved data visualization. This article discusses best practices for logging data to the cloud using suitable protocols, and covers functions such as math manipulations and notifications. A specific application to show how to get started with cloud-based remote access is discussed.
Cloud advantages
There are several advantages of cloud-based data storage and access systems as compared with on-premises systems. Worldwide cloud connectivity only requires access to the Internet via a wired, Wi-Fi or cellular link. On-premises connectivity is considerably more complex, particularly for users located offsite.
Cloud-based data systems can be set up in a matter of hours with little or no upfront capital expenses and can be scaled up in minutes with relatively simple interactions with cloud service providers. By contrast, setting up on-premises data systems always requires substantial upfront capital expenses and information technology (IT) expertise, and scaling up can be very difficult, expensive and time-consuming.
Given these and other advantages, cloud-based data systems and other services are growing rapidly across a wide range of commercial and industrial applications. This rapid growth is causing prices to drop as providers take advantage of economies of scale. Simply put, it’s much less expensive on a per user basis for a cloud service company to provide IT infrastructure to thousands of users than it is for each user to design, install and a maintain his or her own infrastructure.
Data storage in the cloud and access to it allows users to gain insight through data visualization. Configurable dashboards using widgets for remote viewing allow visualization of cloud-based data from any device connected to the Internet such as a laptop, a PC, a smartphone or a tablet (see Figure 1). This data easily can be shared with other users, and it can be downloaded for analysis as needed.
Data logging
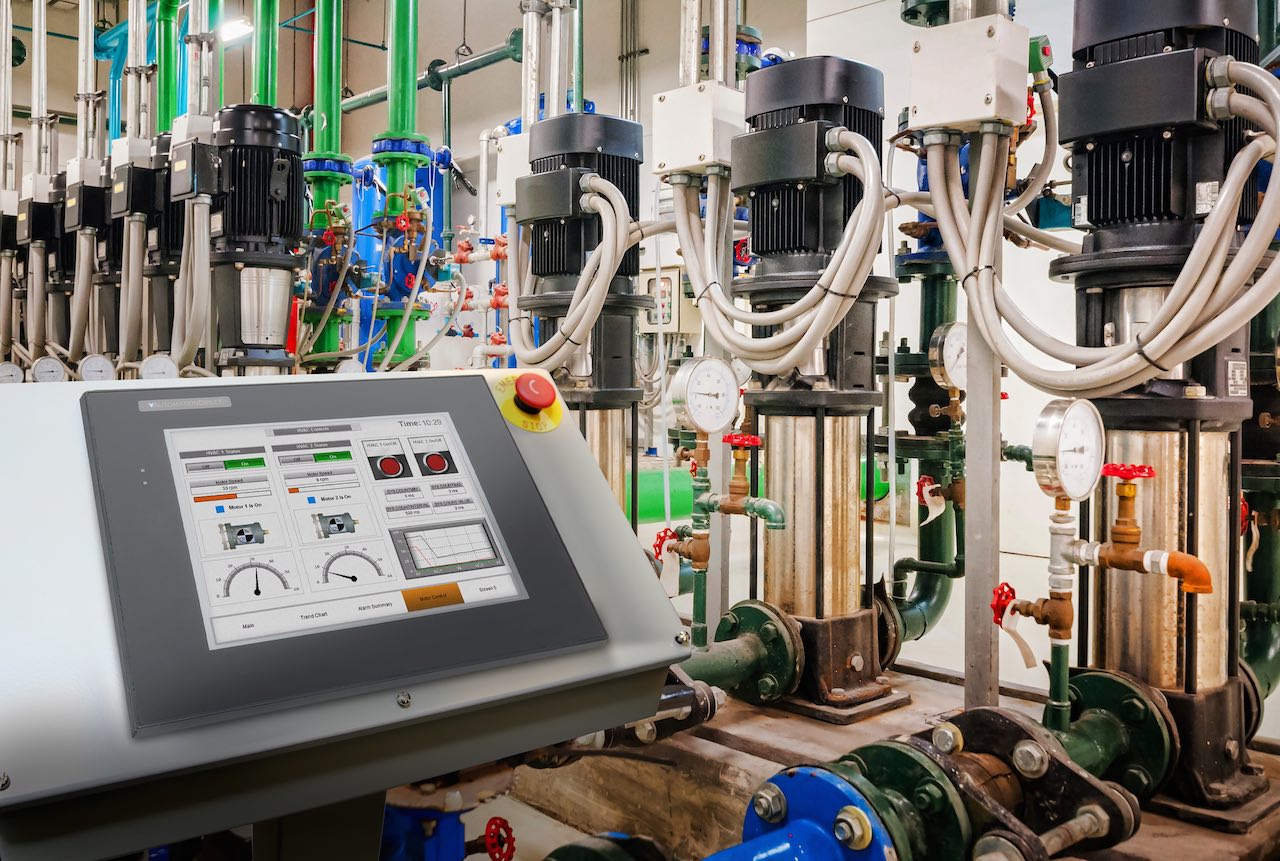
Data logging can be local, cloud-based or a combination of both. Many programmable logic controllers (PLCs) and human machine interfaces (HMIs) include onboard memory for local data storage on an SD-card or a USB drive (see Figure 2). An industrial plant or facility also may have network-based database servers maintained by the IT department.
However, with data logging to the cloud, the possibilities are much greater. It’s possible to create and maintain a cloud-based data system, or to use an end-to-end solution offered by a service provider. Creating a cloud-based data system requires some level of IT expertise, albeit less than doing so on-premises. For example, Amazon Web Services (AWS) is a popular cloud services provider, offering many of the features needed for those wanting to host their own cloud-based data systems.
Another alternative is to subscribe to an end-to-end service offering data logging with a hosted virtual private network (VPN) (see Figure 3). These types of services typically are offered on a monthly subscription basis with costs based on the number of data points recorded. This type of solution provides a quick road to logging data to the cloud and accessing it worldwide for visualization and other purposes. Although every data logging solution does not have a VPN router, using one provides the required security along with remote access and programming functionality (see Figure 4).
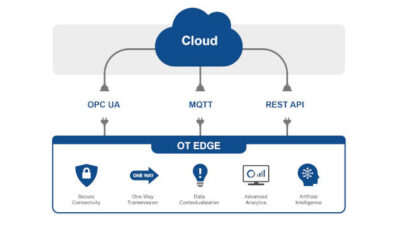
Protocols and router configuration
With the IIoT, there has been a great increase in the amount of available data, with corresponding demands to meet reliability and security requirements, possibly slowing data transfer rates and presenting other problems.
While industrial Ethernet protocols have been advancing, some newer protocols such as message queuing telemetry transport (MQTT) are often a better solution. Many VPN routers work with the newer protocols as well as multiple common industrial Ethernet protocols often used on the plant floor while providing the required security.
Figure 4: These StrideLinx Remote Access VPN routers from AutomationDirect offer secure remote access with a subscription-based data logger and notification included. Courtesy: AutomationDirect[/caption]
VPN routers with data logging often use MQTT technology behind the scenes so users can work with the most common industrial protocols, rather than converting them to MQTT first. Data logging is configured in the router by identifying the tags to be monitored from each component, with the router then logging the data to the cloud with no PLC or HMI programming required.
Data manipulation and notification
Data often needs to be cleansed and manipulated before visualization or notification takes place. At the source, data often is cleansed to eliminate blips, and then sent to the cloud only upon exception; that is when it changes, greatly reducing the data traffic from a site to the cloud. If an alarm or event occurs, data transmission can be switched to send every reading to the cloud for a predetermined period of time to aid with analysis. Other methods of data cleansing or manipulation at the source often are employed depending on the application.
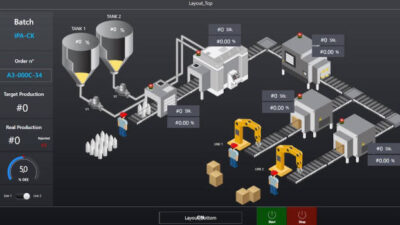
Once the data is logged to the cloud, users need a way to visualize it. Many end-to-end solutions allow live monitoring and creation of widgets for data visualization. Dashboards often are used to add, remove, edit and view both live and historical data reports over a preconfigured time period. Live monitoring displays real-time data in the cloud, providing insight into how the machine or process is operating in near real time.
Widgets can be used to display live and historical data as a number value, or as a Boolean status such as true or false. Typical graphics available to help visualize data include a gauge to display the value within a configurable range and a graph to plot the data over time. Templates also are available to help quickly display cloud data. Tables with data tags and logged values and bar charts over fixed intervals are other commonly used widgets for displaying data. Data reports can be manipulated through use of formulas to customize the data view over a selected time period. Typical formulas include average, minimum, maximum, median, mode, range, sum, first and last.
Alerts and notifications can be configured to inform users when parameters fall outside of a predefined range. For example, alarms can be configured to notify specific personnel when a machine breaks down, needs maintenance or when a temperature runs too high.
Through simple configuration, users can enable a cloud notify function to alert workers based on predefined machine or process conditions. These notifications can be categorized as low, medium or high priority—allowing users to choose which notifications they’d like to receive.
The cloud for all
The cloud works well for small, medium and large companies logging, accessing and visualizing data. The cost of entry is very affordable hardware and a data subscription (free or a monthly fee based on data usage and the service provider), and configuration is quick.
For example, consider Woodwest Controls, a Colorado-based system integrator. Led by owner and founder Chris Kregoski, the company works on brewing, wastewater and other projects. Kregoski started the company in his basement in 2014 and has quickly expanded the scope of the business to service Fortune 1,000 companies, while maintaining a commitment to excellence and customer satisfaction. Kregoski also owns a brewery and designs control systems from start to finish for himself and his customers’ breweries. In addition, his company supports malting companies that prepare the grain before it goes to a brewery.
Microbrewing is a semiautomated process where the brewer is constantly checking temperatures on tanks and vessels throughout the day. Monitoring live data, receiving process completion alerts and creating historical data records of each batch can improve productivity, yields and quality control.
Woodwest Controls uses AutomationDirect’s StrideLinx solution to monitor automation systems installed at their customers’ sites. The main components of these systems are typically an AutomationDirect HMI and PLC. The PLC controls temperatures in the fermentation tanks, and in the brite tanks when clarifying beer. These tanks need to be held at specific temperatures, which must be monitored closely by the brewer (see Figure 5).
The StrideLinx is configured to log the temperature of the tanks and the support systems, such as glycol storage. Tank temperatures for the next day’s brewing uses the live monitor function on the StrideLinx platform, providing near real-time displays of temperatures. The temperatures of 14 fermentation vessels and six brite tanks are monitored using one dashboard with two panels, one for fermentation tanks and one for brite tanks.
With simple configuration, alarms were added to notify employees that a given step is near completion. These process completion alerts, when added to this semiautomated process, improved productivity and yields. Glycol alarms also were configured for high temperature or low pressure to ensure proper chilling of the tanks and improve quality.
Everyone’s IIoT
When it comes to the cloud, think big—there is much that can be done with data logged to the cloud and accessed from it. This data can be used to improve efficiencies in machines and processes. Users can take advantage of these connections to stay informed about production volumes, process status, system alarms, raw material usage, energy consumption, maintenance needs and more.
With the right technology, it’s easy to start small and experiment with remote access and data logging at one site, and then scale up and deploy to other production lines and sites.
This article appears in the Applied Automation supplement for Control Engineering and Plant Engineering.
– See other articles from the supplement below.