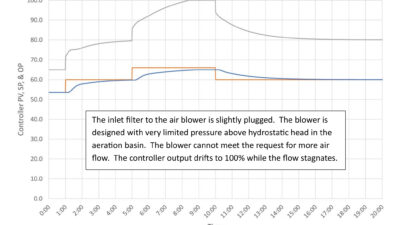
Sticking control valves hurt control and cannot be fixed by tuning. How do we spot a bad control valve? What can be done about a bad control valve?
Control valve insights
- Sticking control valves cause a limit cycle with unique visual cues for different processes.
- A simple manual check can identify a sticking valve.
- Adding a valve positioner or cascading a slow process to a flow controller can reduce the impact a sticking valve has on control.
Bad control valves will warp loop tuning results has been a continuing theme in this series. The truth is that bad control valves adversely affect controller performance.
Furthermore, it is my experience that in facilities that are well-tuned the biggest source of control performance problems is poorly performing control valves – bad valves. Finally, you cannot fix a bad control valve by changing loop tuning. The best that you can do is cover up the bad valve at the cost of making controller performance worse.
Given these realities, when you are asked to tune a controller, you should first (among other checks) verify that the control valve is not the problem. Fortunately, a bad control valve can be identified by looking at the trends or by a few simple tests.
What is a bad valve?
A bad valve is a valve that does not go to the commanded position; if the controller asks for 50% the valve goes to some position other than 50%. A valve that goes to 50.5% is a lot better than a valve that goes to 75%.
A control valve, being a mechanical device, can fail in many ways, most of which are obvious and make control of any kind impossible. For our discussion we are interested in identifying problems that degrade valve performance but do not make control impossible and might be missed if you don’t know what you are looking for. These problems are referred to using the terms hysteresis, stiction, backlash, and stick-slip. These are not entirely interchangeable terms but in general all refer to the same phenomenon. I prefer to use the terms stick-slip and backlash:
Stick-slip: The tendency of a valve to resist movement until enough force has built up on the actuator to overcome standing friction, at which time the valve will slip to a new position which may or may not be the commanded position of the valve. Most often the valve will stop short of the commanded position, but in a minority of cases the valve will overshoot the commanded position.
Backlash: The tendency of a valve to not move when the commanded position of the valve changes direction until the command has moved a minimum amount. Backlash is a natural outgrowth of stick-slip operation.
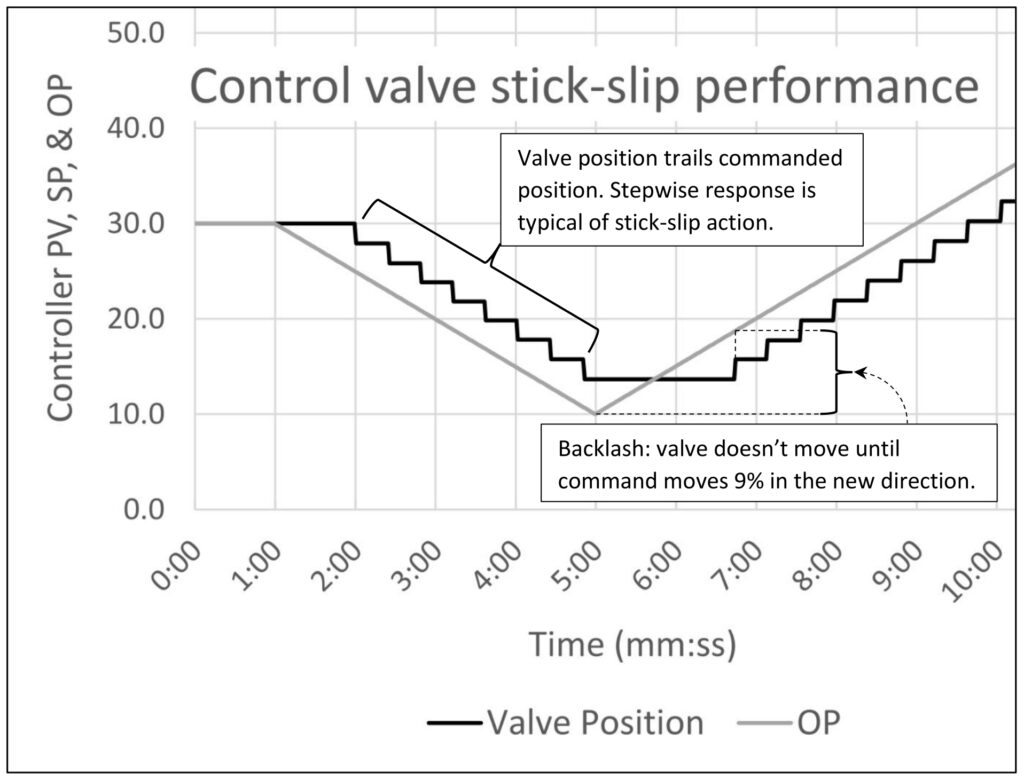
Figure 1 is an example of stick-slip control valve performance. In this case the valve sticks until the commanded position is 5% away from the actual position and then slips 2%, leaving the valve 3% away from the commanded position. If the commanded valve position is moving in one direction the actual valve position will follow in a stepwise pattern between 3 and 5% behind the commanded position. If the commanded position is moving in one direction the controller should be able to get the valve within 2% of where it needs to be for control; the commanded position will move far enough to get the actual position close to where it needs to be. Note that in the real world there is some randomness to the stick-slip action that is hard to capture in a simulation. It would not be unusual to see steps of varying sizes.
Unfortunately, the control problem compounds itself when the commanded valve position changes direction. In this case the commanded position must work back upward through the downward stick range (3-5% in this case) and through the full upward stick range (5%), for a total backlash of 8-10%. As luck would have it in Figure 1 the backlash is 9%.
A control valve with backlash will result in a constant limit cycle when linked to a controller with integral action. Without valve position feedback you will not be able to see how much a valve sticks or any other details of how the valve is misbehaving. You must be able to identify valve performance issues based on how the process responds to the limit cycle that a sticking valve creates. Fortunately, just like controller tuning issues, sticking valves create unique patterns we can use to identify problems.
The first line of defense
The best and most effective solution to valve problems is to install a positioner on the control valve. A positioner is a PID controller that measures the actual valve position and applies air to the actuator to get the valve to match the commanded valve position.
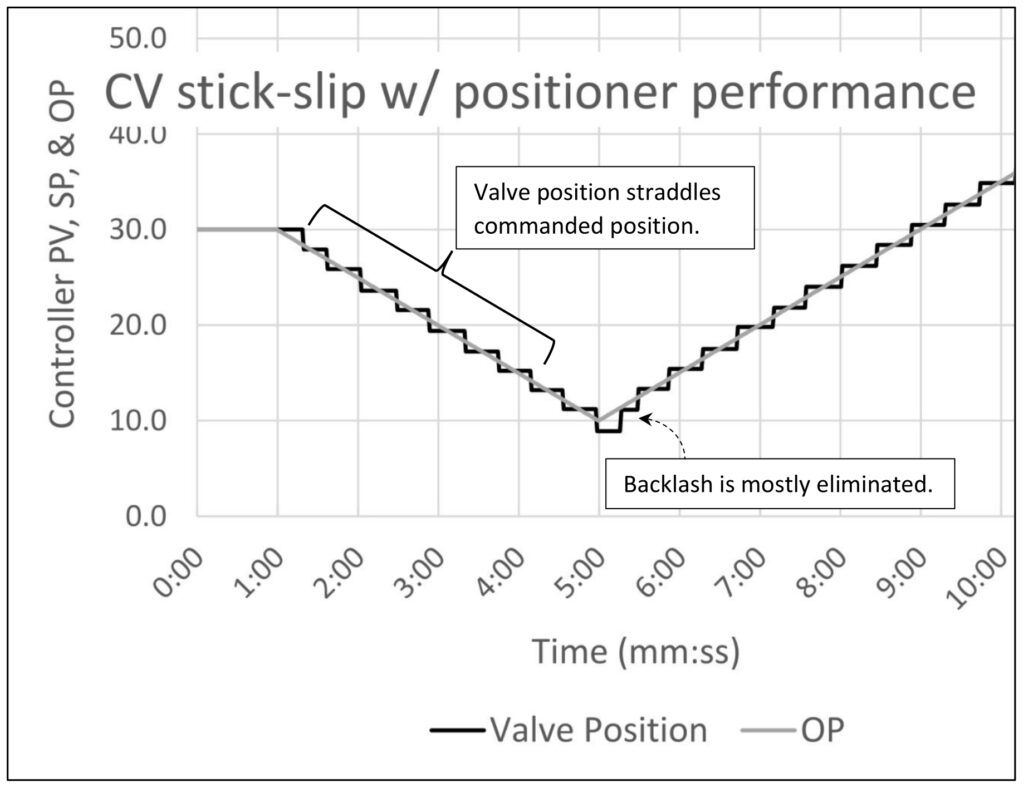
A valve positioner cannot eliminate control valve stick-slip issues; there are limits to what the PID controller can do. However, it can largely eliminate persistent offset between the commanded and actual valve position, which will largely eliminate backlash issues and the limit cycle that accompanies backlash. All your controllers will perform better.
If you work in a facility willing to install expensive valve positioners and the control system supports digital communications (HART, Foundation Fieldbus, Profibus, etc.) trend valve position feedback in the control system and data historian. If your system supports ad hoc trends control valve position feedback should automatically be included in ad hoc trends of controllers. If you are deploying custom faceplates include valve position feedback on controller faceplates. Finally, consider adding deviation alarms between commanded and actual valve position on critical controllers.
Operations and control staff have a strong bias toward believing that the actual valve position matches the controller output (OP). It is my experience that you almost must boldly display the actual valve position to get them to consider that the problem is because the valve isn’t following the commands. Making valve position feedback a part of the normal package of data displayed for every controller helps everyone maintain awareness.
What a bad valve looks like – flow controller
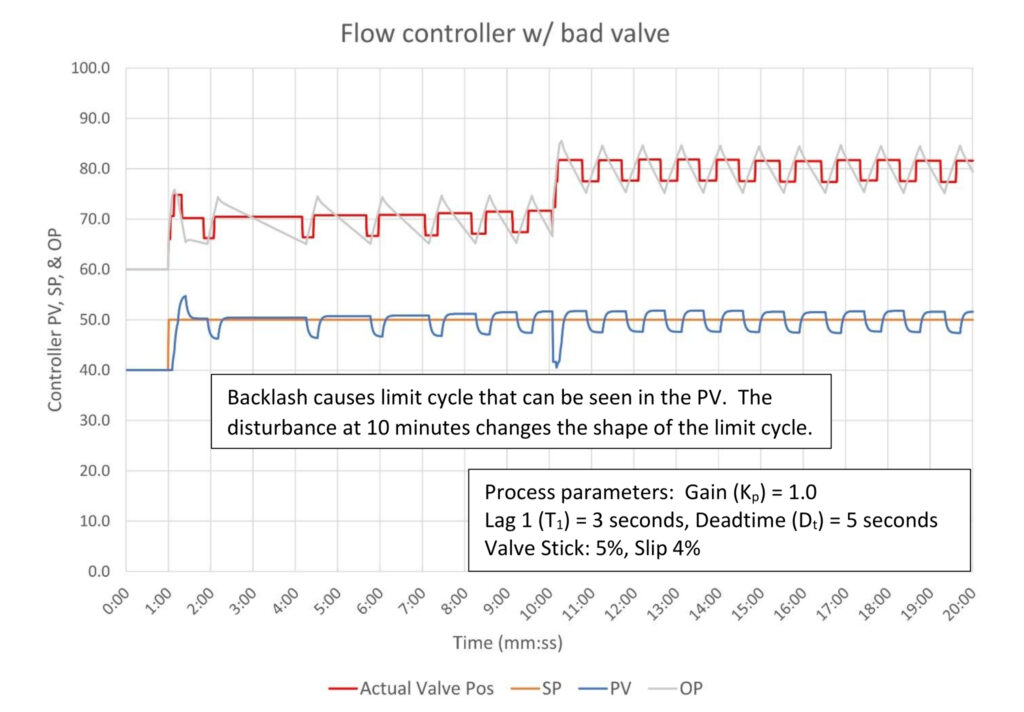
Figure 3 shows a typical trend for a flow controller with a sticking control valve. The actual valve position trend (black) settles quickly into a limit cycle after the setpoint (SP) change. Note how the limit cycle pattern changes after the disturbance at the 10-minute mark. This is normal. Flow process dynamics are very quick relative to the limit cycle, which results in the near square wave seen in the flow process variable (PV). The controller output (OP) will draw a sawtooth trend as integral action attempts to eliminate the difference between the PV and the SP. The actual valve position will step over the position required to meet SP once it slips, which will perpetuate the limit cycle. Naturally, depending on the stick-slip pattern of the valve and the controller tuning constants the pattern can vary greatly. Other than the fact that the flow controller PV is drawing some kind of square wave and the OP is likely drawing a sawtooth wave there is no significance to the size, frequency, or ratio of the high/low parts of the wave.
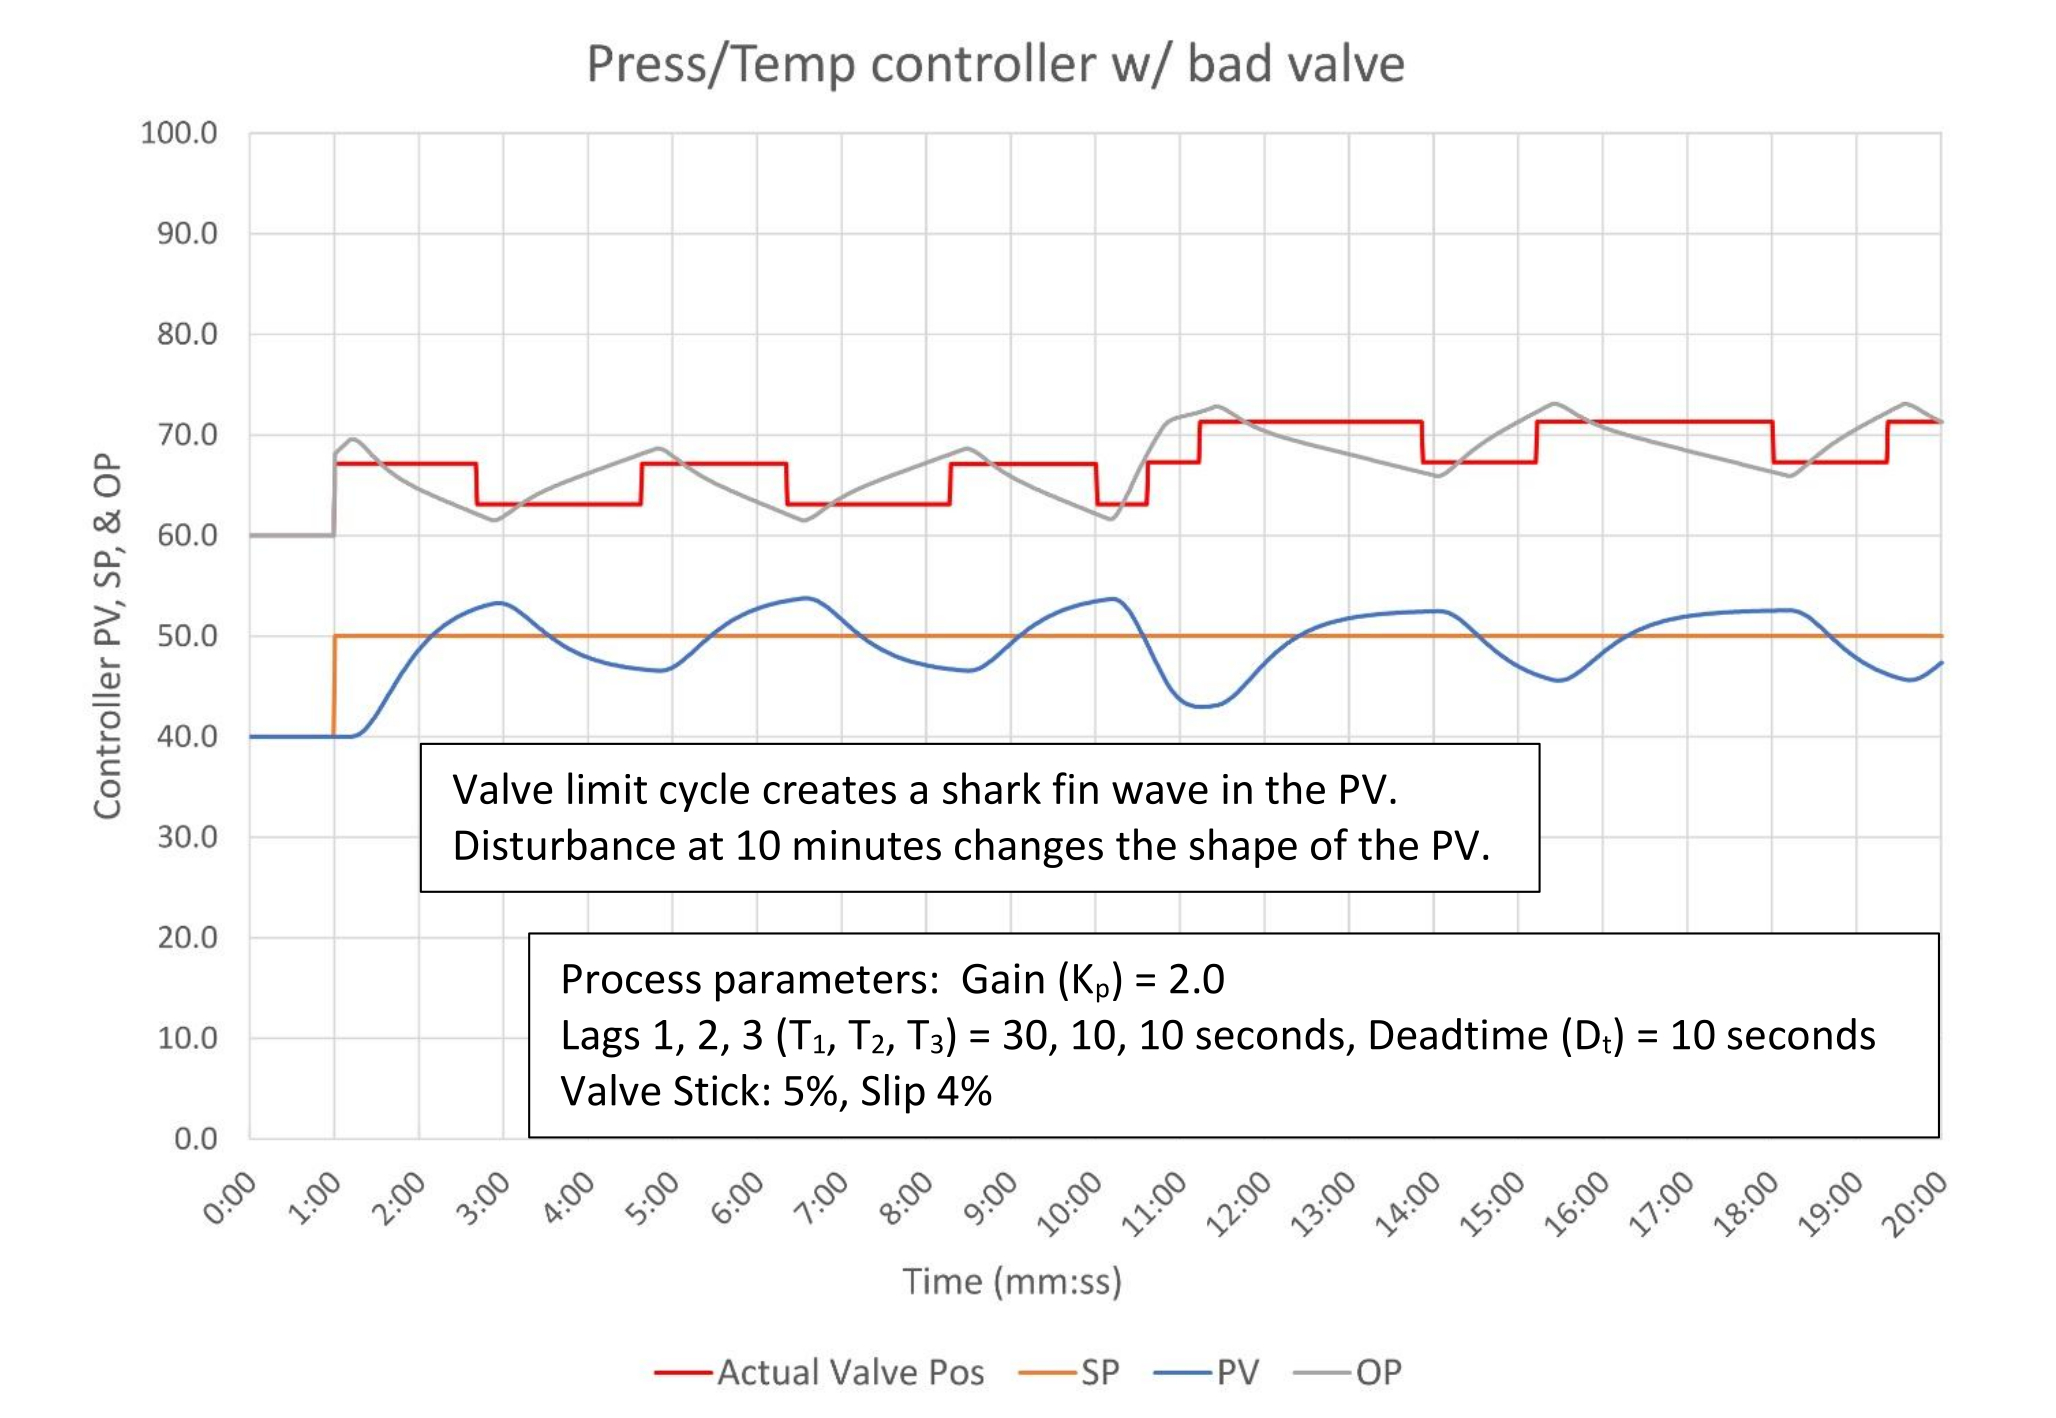
What a bad valve looks like – pressure and temperature controllers
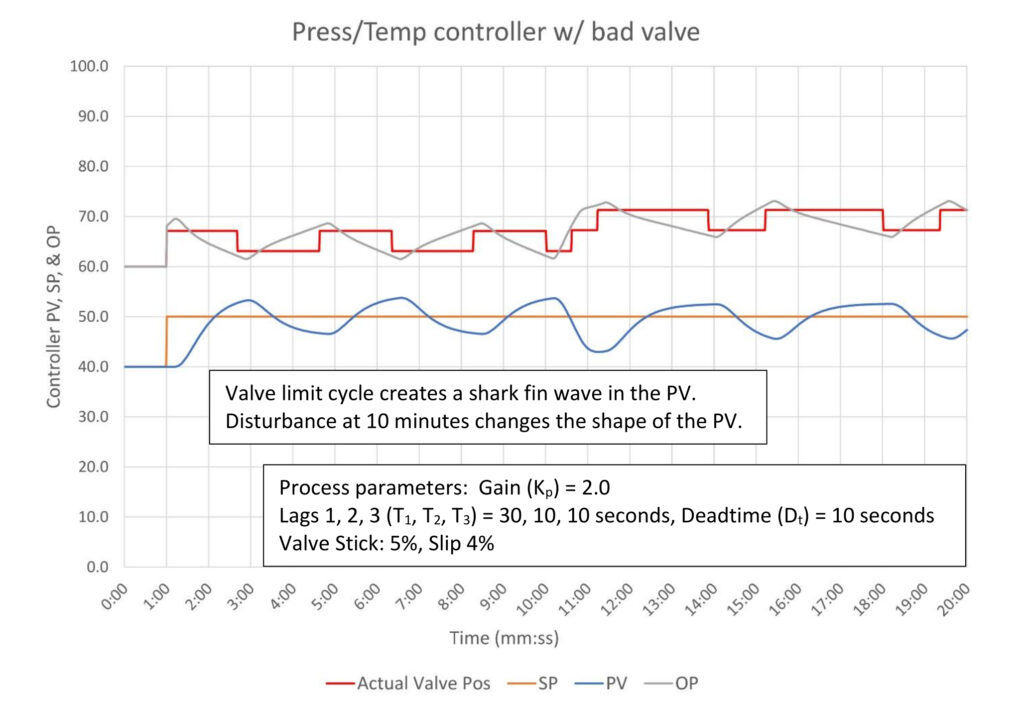
In Figure 4 we see that backlash creates a square wave in the actual valve position, but the slower dynamics of a pressure or temperature controller result in the process variable drawing a shark fin wave. The shape is the response of the process to what is in effect an open loop step test. The disturbance at the 10-minute mark resets the square wave cycle of the valve to have a long upper cycle and short lower cycle which muddies up the shark fin shape a little bit. As with a flow controller, there is no significance to the size, frequency, or ratio of the high/low parts of the wave.
What a bad valve looks like – level controller
Figure 5 shows a couple of different trends for a level controller with a sticking control valve. The square wave nature of backlash creates a constant imbalance between input and output which results in a steady fill or drain of the level. This results in the PV drawing some form of sawtooth wave. In this case we see the more typical symmetrical sawtooth after the SP is changed at the 5-minute mark. After the load change at the 60-minute mark we see a less typical almost square wave in the PV caused by the control valve landing close to perfect balance with the input flow. Integral action eventually pushes the output (OP) to the control valve enough to cause it to slip which results in the valve being temporarily well out of balance. This will last for a short period of time until the valve slips back to being close to in balance again.
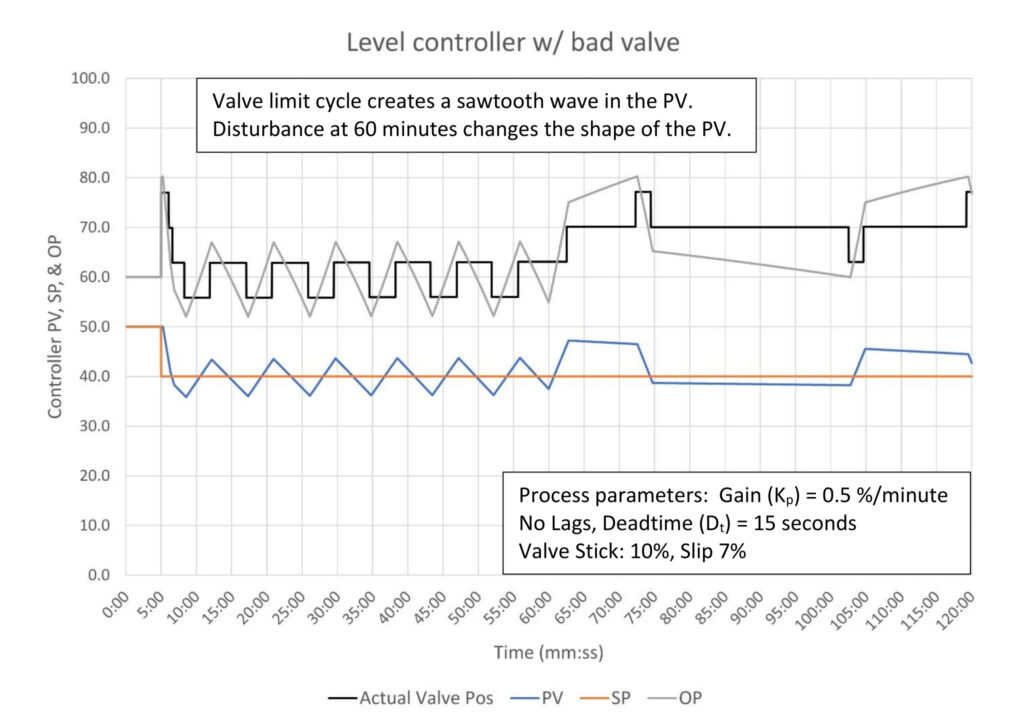
The key spotting feature is that the PV moves in a straight line interspersed with sudden direction changes. The controller OP will also tend to move in straight lines, depending on integral, in parallel with the PV.
Does adding a valve positioner fix a bad valve?
That depends on what you mean by fixed.
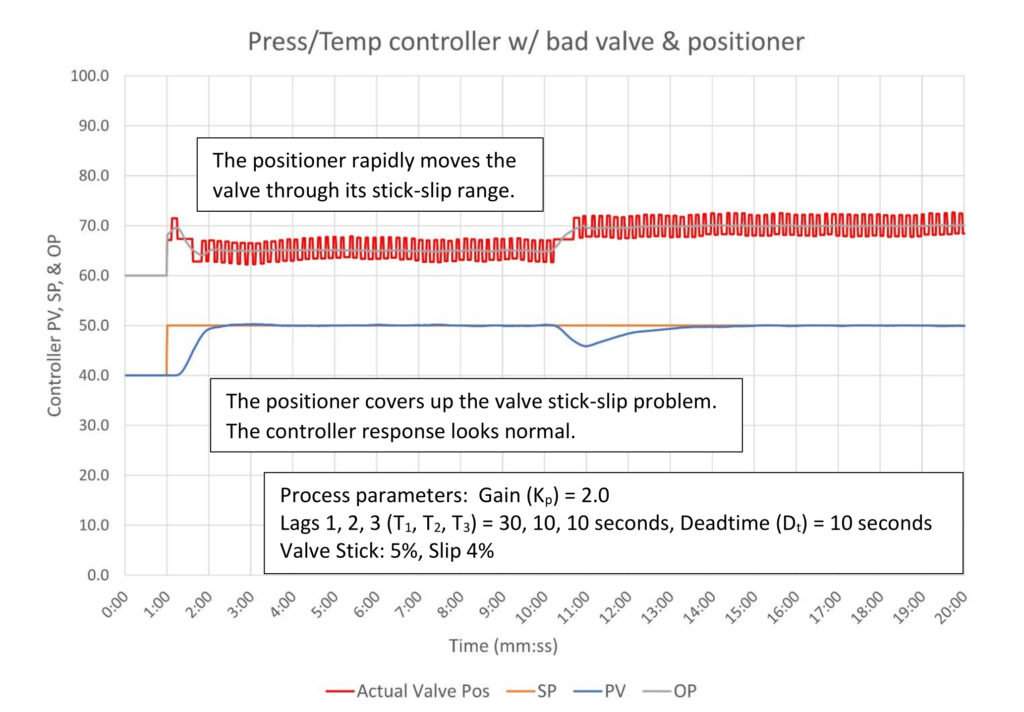
In Figure 6 we see how control of the pressure controller we looked at in Figure 4 changes with the addition of a valve positioner. If we only look at the process variable (PV) and controller output (OP) the response to a setpoint (SP) change and a disturbance both look very good. From this perspective adding a valve positioner has fixed the valve.
However, the positioner is working very hard as can be seen by the constant movement of the control valve. For slow processes the natural lags in the process response wash this out and from a control perspective the valve is fixed. But the valve is getting worn out and air usage is very high. Eventually the valve and/or positioner will break. This is one reason to record control valve position; this information should be available for review by reliability personnel.
Since all valves stick the obvious question is how bad is bad? This valve is bad. 5% stiction is at the outer edges of acceptable valve performance. 1-3% is not unusual depending on the valve type and size, which brings us to the economic incentive to install positioners. 1% stiction on a valve that normally operates at 20% open can result in a 5% swing in the process variable. Depending on the nature of the process and the constraints to be operated against this could result in a significant hidden operating loss.
Can you tune a bad valve?
Instrument technicians will ask you to tune the controller to fix a bad valve. They will insist that poor controller performance is the result of bad tuning, not a bad valve. This is another reason to historize, trend, and display the actual valve position if possible; it absolutely clears up the question of whose fault it is.
The answer is a qualified no. The normal fix for a swinging controller is to reduce the controller gain and/or slow down the integral. This will slow response to setpoint changes and allow disturbances to result in bigger and more persistent process variable (PV) error. The PV will continue to swing but at a slower speed. It may be necessary to slow controller tuning if the sticking valve is causing excessive instability or the speed of the swings is affecting other controllers.
Adding derivative can improve controller performance, but this comes with considerable risk.
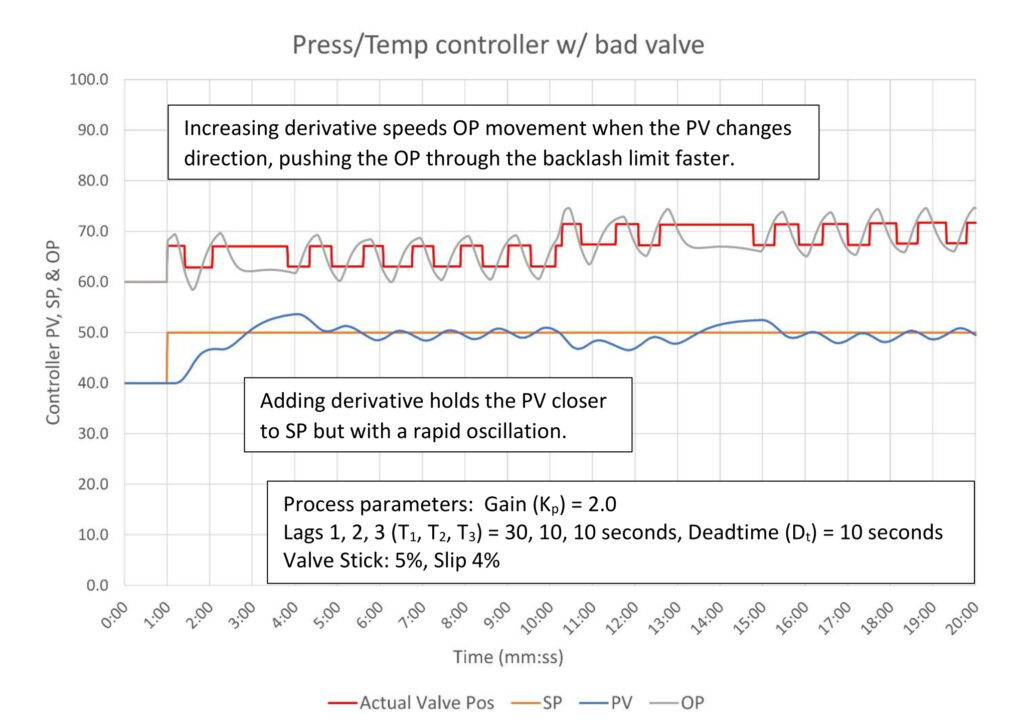
In Figure 7 we see that increasing derivative from 0.25 to 1.0 minutes speeds up the movement of the controller output as the derivative responds to the changes in the process variable’s (PV) direction after the valve slips to a new position. Adding derivative helps push the controller output through the deadband caused by the valve stiction. This works better on a process without secondary lags because the movement of the PV makes a crisp change in direction after the control valve moves.
I do not recommend doing this except in extreme circumstances. I have done this, but with warnings to operators and maintenance to notify me before doing any work on the control valve. There a is a very high likelihood that the controller will be unstable after the valve is fixed.
The loop tuning log should also include a note highlighting what was done, why and how to undo it should some poor soul be stuck cleaning up this mess.
How do I manually check for a sticking valve?
If you are being asked to tune a new controller or if the trends are inconclusive, you should take some time to verify that the valve is working properly. This can easily be done while doing open loop step testing.
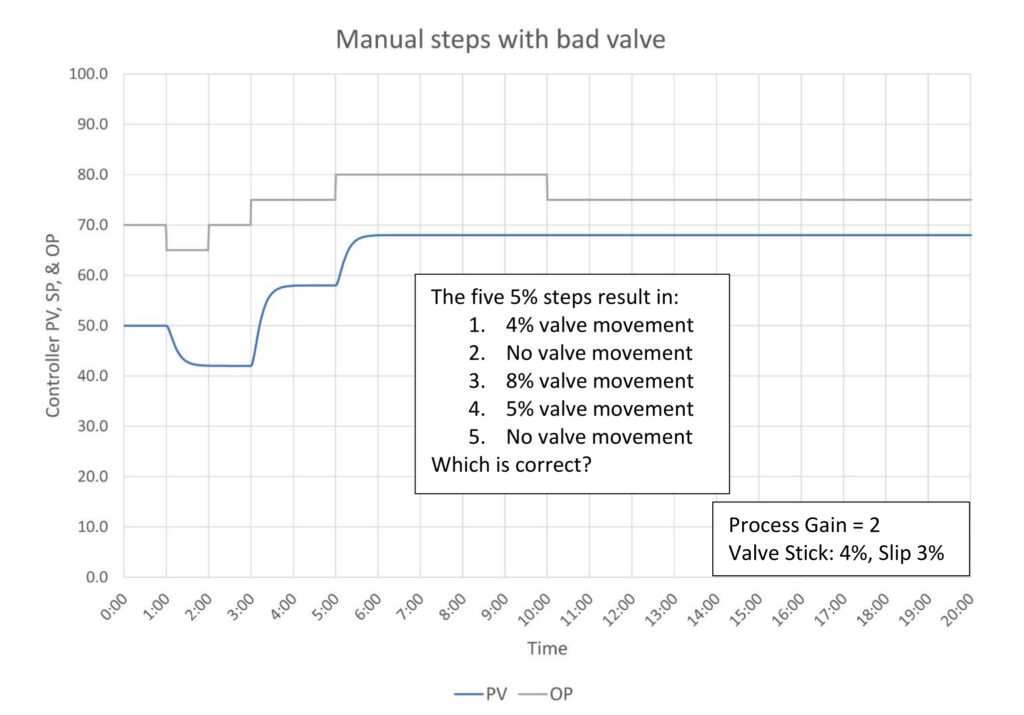
Figure 8 explains shows why multiple steps are recommended during an open loop step test. The five 5% steps resulted in two failures to move and three different valve movements. If you had done just one step you could wind up with wildly incorrect tuning constants or even assumed that the control valve does not affect the process variable.
Let’s walk through each step to understand what happens when tuning a controller with a valve that has 4% stiction and 3% slip:
- The actual and commanded positions were identical before the step. The 5% step is larger than the 4% stiction limit, therefore the valve did move, but stopped 1% short of the commanded position (valve slip stops 1% short of commanded position). If this was your only step you would underestimate process gain by 20%, which would cause you to overestimate controller gain by 20%. This is likely not serious, but you will find yourself retuning to remove the excess controller gain.
- The actual position is 1% above the commanded position. The 5% step moves the commanded valve position to 4% above the actual position. The valve may or may not move as this is the stiction limit; in this case it didn’t. This will puzzle young professionals who do not understand that commanded valve position is not actual valve position.
- The actual position is 4% below the commanded position. The 5% step moves the commanded valve position to 9% above the actual position. The valve moves 8%, leaving its final position 1% below the commanded position. If this was your only step you would overestimate process gain by 60%. The estimated controller gain will be 60% low, and the controller will be very sluggish.
- The actual position is 1% below the commanded position. The 5% step moves the commanded valve position 6% above the actual position. The valve moves 5%, leaving its final position 1% below the commanded position. If this was your only step congratulations, you got the right process gain. Your estimated tuning constants will be correct.
- This is the inverse of step 2 and gets the same results – none.
What we’ve learned here is that the pre-step position of the control valve determines the results of the step test. The second lesson is that we can preload the valve for a successful test by stepping down (or up) and then stepping up (down) twice. The second upward step will likely give us our best open loop test result.
This is all well and good and can be useful if you are tuning a fast process. However, if you are tuning a slow process, say one that takes an hour to come to steady state, you are now committed to two 1-hour steps tests just to get one good result. The initial step down can be followed immediately by a step up because all we want to do here is preload the actual valve position.
We can improve our chances of getting a good step test in just one step by making bigger steps. In this example if we can take a 10% step on step 1 the valve will still stop 1% short of the commanded position. The valve will move 9%, and our process gain estimate will only be 10% low. The controller gain estimate will only be 10% high, which given the limitations of the open loop tuning method may well give us acceptable results. Unfortunately, there are limits to how big the step can be. Operators will want you to use the smallest step possible because they don’t want to deal with the upset that will inevitably result from the step test.
Designing out problem valves
If you haven’t heard this already you will eventually be told that all slow process controllers should be cascaded to a flow controller. This is done to isolate the slow level, temperature, pressure or composition controller from bad valves. We saw up above in figure 6 that a positioner, by working very hard to keep the average valve position on target, effectively hides the valve performance issues from the slower process. This “fixes” the valve for the slow loop. In the absence of a valve positioner a flow controller, being fast, effectively acts like a valve positioner for all slower control loops. The flow controller also linearizes the process response for the slower control loop, which a positioner cannot do.
However, cascading a slow controller to a flow controller is not without problems. Operations will often object to a (for example) level to flow cascade arrangement because flow controllers break. When this happens the operator must now commit most of his attention to watching the level to prevent it from overfilling or emptying out, both of which can result in serious process upsets and possibly equipment damage. The other thing that can happen is the flow meter can show no flow while the control valve is still open. Early in my career this resulted in emptying vessels, which resulted in pump seal failures and fires. This got people excited.
There are programming fixes for these problems.
- All cascade to flow controllers should permit direct level (etc.) control of the valve. In the case of levels if the flow transmitter goes bad the level controller should automatically take over control of the valve. You have more leeway with self-limiting processes because they are not likely to run away.
- All flow secondaries should be programmed to close the control valve if the controller is in auto or cascade, the setpoint is zero, the flow measurement is zero, and the valve is not closed.
These two changes have eliminated operations’ objections to cascaded controllers allowing overall better control. This of course also makes tuning these slow controllers much easier, faster and more accurate by eliminating the largest source of tuning problems.
CONSIDER THIS
Can we spot a sticking control valve just by looking at the trends? Is there a simple test we can use? Is there equipment we can add to a valve or logic changes we can make to improve control even though a valve sticks?
PID series from Ed Bullerdiek, retired control engineer
Part 1: Three reasons to tune control loops: Safety, profit, energy efficiency
PID spotlight, part 2: Know these 13 terms, interactions
PID spotlight, part 3: How to select one of four process responses
PID spotlight, part 4: How to balance PID control for a self-limiting process
PID spotlight, part 5: What does good and bad controller tuning look like?
PID spotlight, part 6: Deadtime? How to boost controller performance anyway
PID spotlight, part 7: Open-loop tuning of a self-limiting process
PID spotlight, part 8: Closed-loop tuning for self-limiting processes
PID spotlight, part 9: Heuristic tuning for a self-limiting process (part A on heuristic tuning)
PID spotlight, part 10: Heuristic tuning in a self-limiting process
PID spotlight, part 11: How a PID controller works with an integrating process
PID spotlight, part 12: What does good and bad controller tuning look like?
PID spotlight, part 13: Deadtime: what’s the best that I can do?
PID spotlight, part 14: Open loop tuning of an integrating process
PID spotlight, part 15: Open loop tuning of near integrating processes
PID spotlight, part 16: Close loop tuning of an integrating processes
PID spotlight, part 17: Heuristic tuning of an integrating processes
Aug. 1 RCEP webcast available for one year: How to automate series: The mechanics of loop tuning
More on PID and advanced process control from Control Engineering