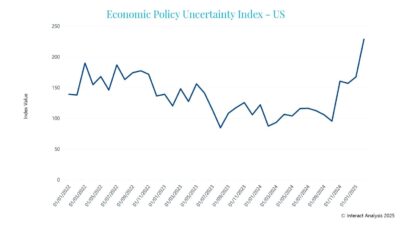
Benefits and salaries increased. Artificial intelligence and machine learning top the list of leading automation technologies. The economy and workforce shortages are tied among manufacturing business challenges at 38% with taxes and tariff second at 27%, jumping from 8% last year.

Control Engineering 2025 salary and career research insights
- Understand that 2025 Control Engineering Career and Salary Report covers salaries, benefits, automation trends and technologies related to manufacturing challenges.
- Learn that automation experts receive higher salary and benefits in 2025 than 2024.
- Explore trends about engineering job satisfaction, hours for those working with automation, controls along with survey methods and demographics.
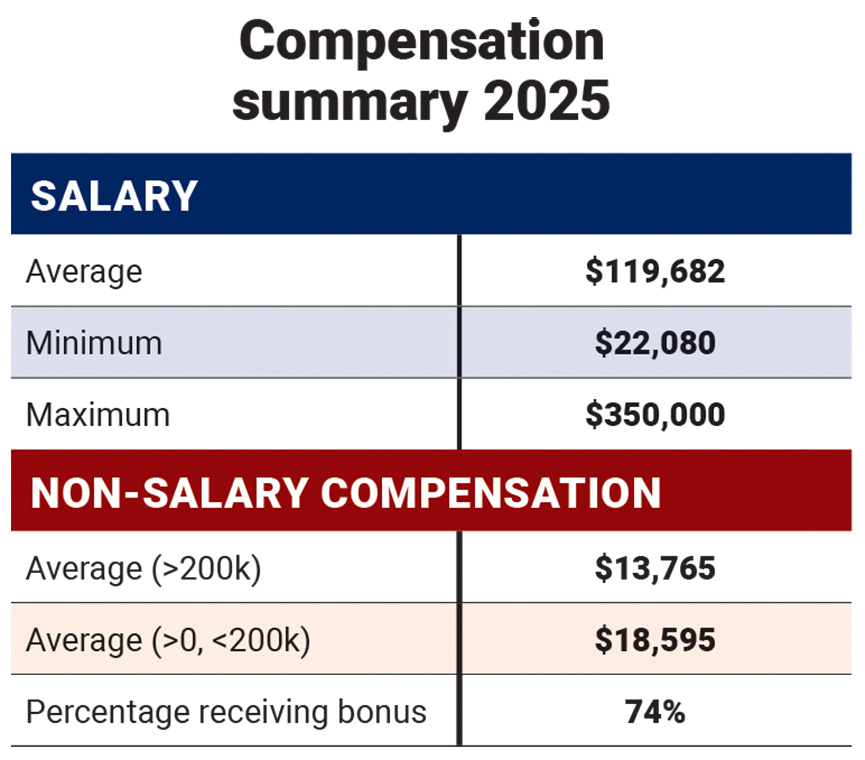
The economy, labor shortages and tariffs are among leading challenges while artificial intelligence and machine learning are among leading technologies that will help those responding to the 2025 Control Engineering Career and Salary Survey and Report. Salaries and benefits increased for Control Engineering subscribers responding. Salaries increased to an average $119,682 (Figure 1), a 4.3% increase compared to $114,771 for those taking the survey in 2024, and up from $111,345 the 2023 survey. The average of those receiving bonuses increased to $18,595 (Figures 2, 3), compared to $16,125 reported last year.
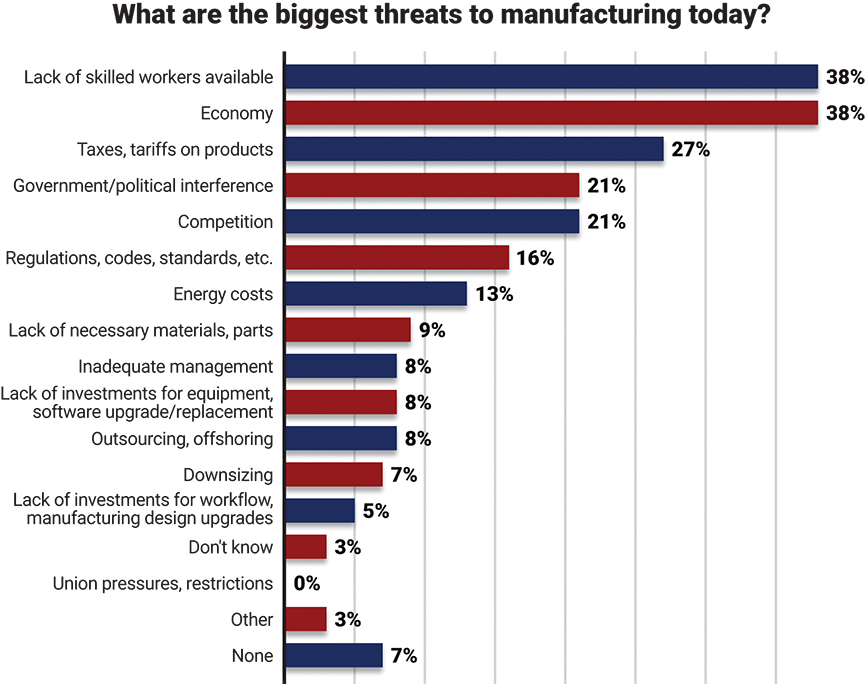
Leading threats (Figure 4) to manufacturing businesses (select up to three, the survey said) was the economy and lack of skilled workers, tied at 38%. In 2025, taxes and tariffs was second at 27% as a leading threat, soaring 19 percentage points from 2024 when just 8% said it was a leading threat. Tied for third were government/political interference and competition at 21%. In 2024, the economy was the top threat at 41%, and lack of available skilled workers was 33%, while competition and government/political interference and regulations, codes and standards were in a three-way statistical dead heat for third, around 19%.
Automation technologies to resolve key manufacturing challenges
What technologies will be helping in the coming year? (Figure 5) Among a plentiful list of automation technologies expected to help, artificial intelligence and machine learning (AI/ML) moved solidly into first place in 2025 at 36%, up 8 percentage points from third in 2024 (28%), and eighth in 2023. Below AI/ML in first, no technology listed was separated from its neighbor by a percentage greater than the margin of error for the research, at +/-5.8% at 95% confidence in 2025.
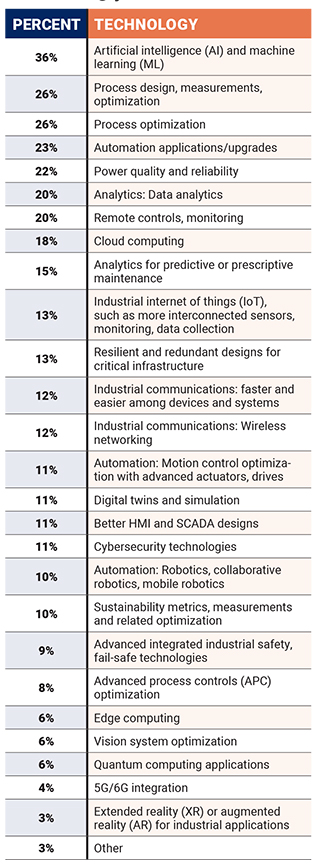
Second place was a tie between process design, measurements and optimization (grouped together) and process optimization (on its own), both at 26%.
Sharing third place statistically was a group of five technologies, all within 5 percentage points:
23% Automation application/upgrades
22% Power quality and reliability
20% Analytics: Data analytics
20% Remote controls, monitoring
18% Cloud computing
See graphic for 18 other automation technologies likely to help.
Added for 2025 were quantum computing applications (6%), 5G/6G integration (4%) and extended reality or augmented reality for industrial applications (3%). Note that wireless networking and industrial communications also are listed separately tied, at 12%.
Those were among the 2025 salary and career survey highlights. Below find more results. Download the full report (and other Control Engineering research).
Anticipated increases for automation experts
Automation, controls and instrumentation help manufacturers operate more efficiently and fill the skills gap. Automation professionals see themselves part of the solution with 68% expecting an increase in base annual salary, similar to the last three years.
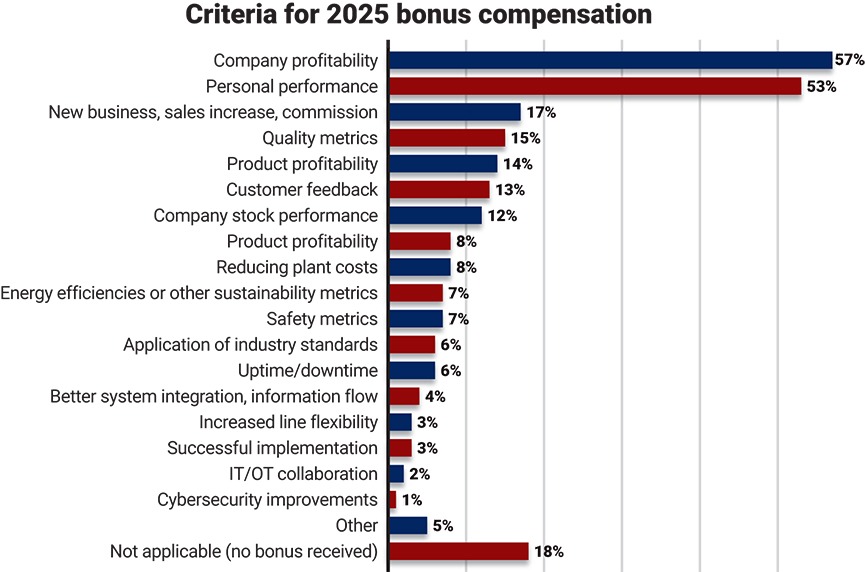
Company profitability (57%) and personal performance (53%) remain statistically tied in 2025 as the dominant criteria for bonus compensation. The next five bonus criteria were tied for second (Figure 6).
Pick up to three factors for job satisfaction with automation, controls
Work-life balance (described as “workload, flexible work hours, ability to work from home, etc.”) was added among factors for job satisfaction in 2025 and immediately scored highest at 42%. Financial compensation (last year’s top factor) tied at second at 28% with feeling of accomplishment at 30%, a 10-percentage-point increase over 2024. The next five criteria tied for third, all within the margin of error: relationship with colleagues at 21%, job security 19%, technical challenge 19%, relationship with boss 17% and benefits 17%. Figure 6 shows 10 other criteria.
To follow-up with work-life balance, a new question in 2025 asked about percentage of work performed remotely; 70% performed some work remotely, with the largest grouping, 27%, fell in the 1% to 20% range. Interestingly, 16% performed more than 80% of their work remotely. In hindsight, clarification is needed to discern between working at home and working someplace other than the office, such as a client’s site for a control system integrator.
Hours worked nearly equaled respondents from 2024 research:
- 7% worked fewer than 40
- 11% in 2024, 9% in 2023
- 11% in 2022
- 53% worked 40 to 44 hours
- 48% in 2024
- 42% in 2023
- 43% in 2022
- 17% worked 45 to 49 hours
- 19% in 2024
- 24% in 2023
- 29% in 2022
- 13% worked 50 to 54 hours
- 13% in 2024
- 14% in 2023
- 9% in 2022
- 3% worked 55 to 59 hours
- 3% in 2024
- 3% in 2023
- 3% in 2022
- 7% worked 60 or more
- 6% in 2024
- 8% in 2023
- 5% in 2022
Help from a stunning diversity of automation-related technologies
Control Engineering subscribers develop, integrate and use a wide diversity of controls, automation and instrumentation. In 2025, subscribers selected from among 26 technologies, up from 23: “What technologies are most likely to help you in the coming year? Check all that apply.” In 2024, seven replies were in a statistical dead heat for the top spot, but AI/ML dominates the top spot in 2025 at 36%, as discussed above (Figure 5). Twenty-three percentage points separate the top from the bottom technology in 2024 and in 2025, except for the break-away AI/ML in 2025, 10 percentage points above the others.
AI/ML’s impact was suggested in 2024 Control Engineering and Plant Engineering research saying: “When asked what factors are considered when deciding whether or not to implement AI-based automation solutions in industrial processes, the leading responses were: Operational efficiency gains; cost and return on investment (ROI); and availability and quality of data.” Read more in a Feb. 1, 2024, article, “Research: What are obstacles, advice for integrating AI, industrial automation?”
Survey methods for 2024 career and salary report
Research for the 2025 Control Engineering Career and Salary Report resulted from an emailed survey to subscribers, producing 286 qualified responses from March 21 to April 8, 2025, for a margin of error of +/-5.8% at a 95% confidence level. Survey respondents were invited to anonymously provide their annual compensation information and opinions on the current state of their facilities and industries as well as submitting advice for peers.
Engineering salary, bonus details
Here are some additional details from our salary survey:
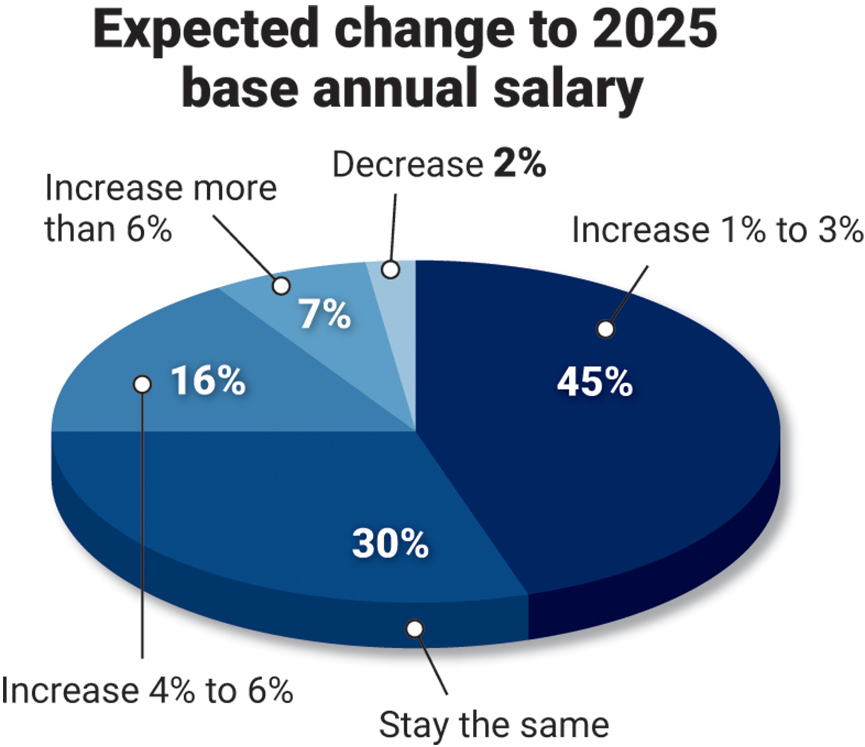
- 45% expect a salary increase of up to 3% in 2025
- 42% in 2024
- 45% in 2023
- 45% in2022
- 51% in 2021
- 52% in 2020
- 63% in 2019
- 56% in 2018
- 16% expect an increase of 4% to 6% or more
- 18% in 2024
- 19% in 2023
- 12% in 2022
- 14% in 2021
- 18% in 2020
- 11% in 2019
- 19% in 2018
- 7% expect more than 6% increase
- 6% in 2024
- 7% in 2023
- 10% in 2022
- 30% expect the same
- 31% in 2024
- 28% in 2023
- 32% in 2022
- 32% in 2021
- 30% in 2020
- 25% in 2019
- 23% in 2018
- 2% expect a salary decrease
- 3% in 2024
- 1% in 2023
- 1% in 2022
- 3% in 2021
- 1% in 2020
- 1% in 2019
- 2% in 2018
For base salary compensation, the minimum was:
- $22,080
- $20,000 in 2024
- $22,000 in 2023
- $20,000 in 2022
- $28,000 in 2021
The maximum was:
- $350,000
- $360,000 in 2024
- $300,000 in 2023
- $266,700 in 2022
- $250,000 in 2021
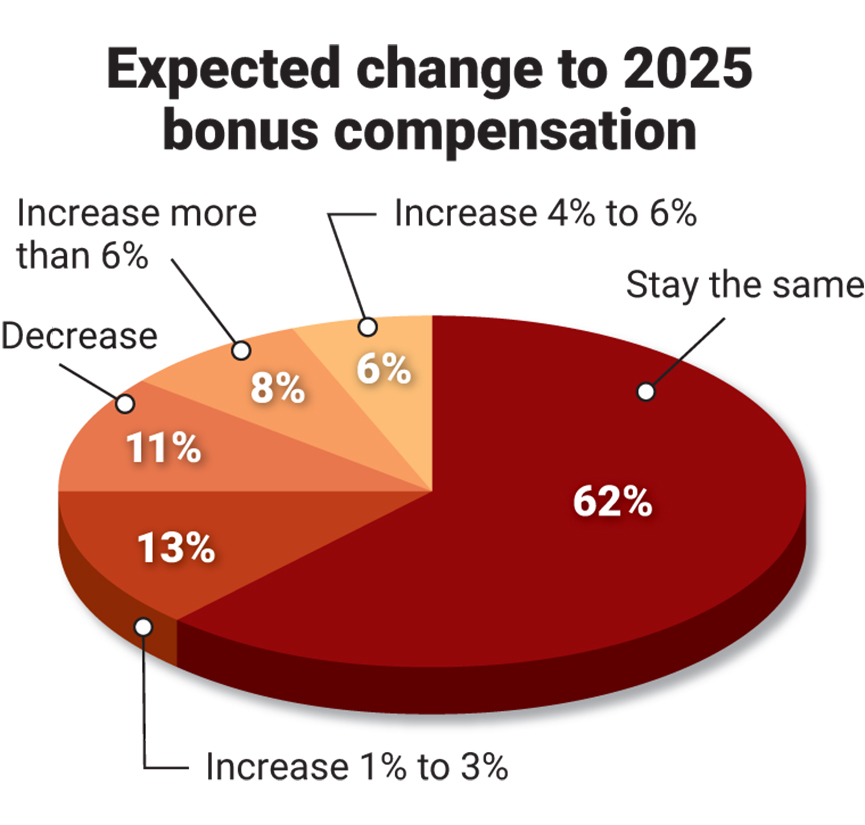
For bonus compensation, 13% expect an 1% to 3% increase (18% in 2024; 15% in 2023); 6% expect an increase of 4% to 6% (same in 2024 and 2023); 8% expect an increase greater than 6% (7% in 2024; 8% in 2023); 62% expect about the same (59% in 2024; 57% in 2023); and 11% expect less (10% in 2024; 14% in 2023).
For those receiving bonus compensation, the average received was $18,595, compared to $16,125 and $15,929 in the two years before). The average across all respondents is $13,765, compared to $11,840 the year before); 25% received no bonus (25% last year).
Engineering bonus criteria
Two leading criteria for non-salary compensation were statistically tied: company profitability at 57% (51% in 2024; 55% in 2023), and personal performance at 53% (51% in 2024; 43% in 2023). New business/sales at 18% (17% in 2024 23% in 2023); quality metrics at 15% (14% in 2024; 17% in 2023); product profits at 14% (9% in 2024; 19% in 2023), customer feedback at 13% (15% in 2024; 10% in 2023) and company stock performance at 12% (10%in 2024; 13% in 2023), among other responses.
Engineering job satisfaction, manufacturing threats shift
As mentioned, work-life balance (new among factors listed for job satisfaction) was the most important, followed by feeling of accomplishment and technical challenge (tied), followed by relationship with colleagues, job security, technical challenge, relationship with box and benefits all tied for third.
Among manufacturing threats, far and away the economy and lack of skilled workers tied for the lead at 38%; taxes and tariffs, just 8% in 2024, soared to 27% in 2025; in a three-way tie for third are government/political interference, competition and regulation codes and standards.
Slightly younger engineers, years at work, education
Control Engineering research provides demographics as context, and extra figures in the report provide more information and benchmarking, examining compensation by years, education, years in industry, by hours worked by employees managed, by job function and by facility size.
Among those surveyed last year and this year, age is about the same: those under 45, as 45 or older last year and this year. In 2025, 6% are under 30 years of age (5% in 2024; 2% in 2023; 1% in 2022); 11% at 30 to 39 years of age (15% in 2024; 9% in 2023; 7% in 2022), 20% at 40 to 49 years of age (18% in 2024; 15% in 2023; 16% in 2022); 25% at 50 to 59 years of age (22% in 2024; 29% in 2023; 32% in 2022); and 37% at 60 and older (40% in 2024; 45% in 2023; 42% in 2022).
Years working for current employer is about the same with 49% at 9 years or less (50% in 2024; 36% in 2023; 43% in 2022), 22% at 10 to 19 years (23% in 2024; 29% in 2023; 26% in 2022), 16% at 20 to 29 years (17% in 2024; 20% in 2023; 18% in 2022) and 13% at 30 or more years (10% in 2024; 15% in 2023; 13% in 2022).
Years in current industry was nearly identical: 15% at 9 or fewer years (14% in 2024; 9% in 2023); 18% at 10 to 19 years (19% in 2024; 14% in 2023); 20% at 20 to 29 years (20% at 2024; 24% in 2023); 27% 30 to 39 years (27% in 2024 30% in 2023) and 20% at 40 years or more (20% in 2024; 23% in 2023).
Highest level of education completed were: 1% high school diploma (<1% in 2024; 3% in 2023), 6% trade/technical school diploma (2% in 2024; 4% in 2023), 5% associate degree (6% in 2024; 8% in 2023), 5% college attendance (5% in 2024; 10% in 2023), 54% had a bachelor’s degree (56% in 2024; 39% in 2023; 48% in 2022), 22% had a master’s degree (24% in 2024; 30% in 2023; 23% in 2022), 5% dual bachelor’s degrees (5% in 2024; 2% in 2023) and 2% a doctoral degree (1% in 2024; 4% in 2023).
Mark T. Hoske is editor-in-chief, Control Engineering, WTWH Media, [email protected]. Amanda Pelliccione, marketing research manager, WTWH Media, conducted the research and assembled the related report available online.
MORE ANSWERS
For more information, see this article online and download the Control Engineering 2025 Career and Salary Report.
CONSIDER THIS
On the next pages, see related articles on:
ONLINE
Download the full 2025 Control Engineering Career and Salary Survey and Report to see more details, including benchmarking tables.
Learn more about workforce development.
See recent Control Engineering magazines