Sasolburg, South Africa, is home to one of the world's only viable coal-derived oil refineries. It is also the headquarters of Sasol, a diversified petrochemical, mining, and energy company. Looking to achieve the next level of control over its vast operations, Sasol asked representatives from Invensys, a global industrial automation, transportation and controls vendor, to explain more about it...
Sasolburg, South Africa, is home to one of the world’s only viable coal-derived oil refineries. It is also the headquarters of Sasol, a diversified petrochemical, mining, and energy company. Looking to achieve the next level of control over its vast operations, Sasol asked representatives from Invensys, a global industrial automation, transportation and controls vendor, to explain more about its new Dynamic Performance Measures (DPM) approach to strategic operations management. DPM is said to support the creation of an operating environment where everyone from workers on the plant floor to plant managers and corporate executives make informed decisions. More critically, they can view the contribution those decisions have on achieving strategic business objectives immediately, making it possible to fine tune actions in near real time. With that level of information visibility, assets are not only managed, but optimized. Enterprise performance management (EPM) is made possible, and operators and controls engineers are empowered to directly affect bottomline costs.
Based on this knowledge of DPM, Sasol chose to use its Infrachem Utilities and Syngas division for a DPM pilot project. Infrachem produces electricity, demineralized water, and steam used in the production processes of several internal customers, including Sasol’s mix of plants that produce petroleum and diesel fuel from coal and natural gas, as well as chemical products, including polymers, solvents, olefins, waxes, and nitrogenous products.
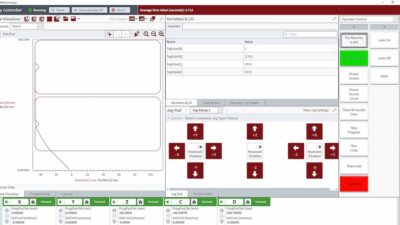
After the Infrachem division pilot project, plant floor operators, control engineers, and business managers each have a graphical dashboard displays of dynamic performances measures (DPMs) that are specific to their individual tasks and functions
Infrachem’s Steam Station 1 and Steam Station 2 were deemed ideal pilot sites. They were then operating below capacity due to a reduction in steam demand that had shifted focus from maximum utilization to minimal cost. They also provided a manageable, self-contained project for prototyping a real-time performance measurement system that could validate alignment with the company’s manufacturing strategy and then be deployed more broadly.
“When we perform an engagement like this, we don’t focus on operating metrics or financial metrics alone, but look at all relevant information to help customers make better decisions,” says Russ Barr, director of the Invensys performance measurement group.
“We didn’t want to focus here just on improving operating efficiencies, for example, because that might blind personnel to ensuing problems with emissions,” Barr says. It’s important to be cognizant, he says, of all critical issues that could arise from the mix of factors being addressed.
“You might be driving a boiler toward greater efficiency, but in the process, you might be adversely affecting costs somewhere else,” Barr says.
Sasol’s information management group invited Invensys to come to Sasolburg to analyze the situation and recommend solutions. Invensys’ patented “engagement methodology” revolves around five focal areas that frame a set of intensive, detailed-oriented meetings and workshops attended by a broad, cross-functional group of stakeholders.
“First we aim to gain a financial view of the domain,” says Barr. With the initial focus at Sasol on steam generation, “we focused on gaining a division perspective—understanding steam generation at a strategic level, how it meets major business objectives.”
The second area of focus is operations: “who does what; how they’re organized to do it; and where the responsibilities lie,” Barr says. Third is getting a clear perspective on the technology infrastructure; mapping out what’s in place and needs to come into play to support DPM. Fourth “is the human resources factor. Getting profiles of the people who will be using the solution.” And not to be overlooked: “Change management practices have to be considered,” he says.
Bringing top management into the working sessions is critical, Barr states. At Sasol, this involved both the plant manager and the division general manager. “When the general manager talked about strategy, team members and workers picked up numerous new insights,” he says. This was augmented by the plant manager who clarified points in the strategy for achieving the vision. “It made it easier for people to grasp the connections between the vision and the plant strategy for achieving it,” he says.
(For this article, Sasol’s IT management provided a detailed write up of what happened next, but scheduling problems prevented them from being directly interviewed. Barr speaks on their behalf.)
Functional decomposition
This was followed by detailed functional decomposition, mapping, and analysis of both steam plant operations. Each station has multiple boilers that serve a single header feed that supplies steam to all sites. Business objectives were then overlaid to determine exactly how best to achieve top priorities.
“The goal is to figure out the right way to manage steam generation—rather than merely running both steam stations hard—which was the rationale operations had lived by for the last 10 years,” Barr says. This detailed analysis and mapping is crucial in yielding greater depth of understanding and revealing additional opportunities for tapping hidden value.
“The process is not a simple one-to-one link in decomposition of factors,” Barr says. With two steam stations in play, the goal was to determine the operating strategy that best served the strategic objective. This involved considering a variety of options, from running one unit full out to keep the second from needing to be used at all, to variations of balancing service between the two. Upstream and downstream interdependencies were also carefully scrutinized.
“Looking at all the interdependencies provides additional opportunities not originally perceived,” says Barr.
The project’s top priority was achieving lower-cost steam generation, and maximizing use of existing technology was paramount. This included a dedicated Yokogawa distributed control system (DCS) that managed one station, and a dedicated Bailey DCS for managing the other. Both DCS platforms provided control, historization and a graphical user interface. At project initiation, neither DCS was heavily loaded, which presented opportunity for hosting additional applications. Both were connected to and fed process control information to an Aspentech IP21 data historian server for data aggregation and analysis.
Most communication connections between the DCS and the IT layer are bi-directional, permitting process data manipulated by the historian to be fed back to the DCS for display. Additionally, Infrachem uses SAP R/3 ERP as its main enterprise backbone. Information from the SAP Sales and Distribution, Materials Management, and Production Planning modules provide inputs to the production costing system and monthly management reporting systems. Production volumes taken from SAP are used to derive variable costs from the Plant Maintenance module. Allocated costs in SAP are used in overall product costing.
Steam plant operations
Steam Station 1 supplies steam at 425 °C to 430 °C at 41 to 42 bar (a pressure measurement) while attempting to maintain constant steam delivery. Steam Station 2 supplies steam at 450 °C at 40.2 bar and serves as the swing plant for handling manually-controlled load variances. Maintaining specified bar is necessary to efficient conveyance of steam for industrial use.
Individual boilers can be operated with either two or three grinding mills that feed them coal. Two mills produce 80 to 110 tons of steam capacity per hour; three mills generate 110 to 145 tons per hour. Boiler efficiency is defined as the heat transferred to steam, divided by the fuel heating value. Generally, heat transfer efficiency is associated with monitored release stack temperature, while combustion efficiency is associated with excess air feeds and other factors. Other variable costs include demineralized water and electricity.
Since many of the boiler operations are manual, helping operators better understand overall boiler economics vis-à-vis overall plant operations and broader division strategy was deemed critical for improving strategic business performance. Operators were, in essence, deemed front-line contributors to cost improvements.
The Invensys structured methodology was used to determine the correct boiler performance measures at the lowest level permitting them to be managed effectively. This enabled clear linkage of process factors—and their cost impacts—with higher level strategic business objectives. To ensure performance improvement, the performance measures needed to be visible and in sync with the processes themselves. This enables a feedback cycle that registers causal effect of actions taken by operators in real time. The team identified three key steam station DPMs: steam cost, steam quality, and production rate.
The objectives of each boiler are to produce the lowest cost steam at the proper pressure and temperature specified; to maintain reliable production; and to maintain production rates. For each boiler, the variable steam-generating cost, including labor, consists of four major components: coal consumption (the largest cost), electricity, fuel oil, and water. To get a cost per ton, this sum is divided by the total amount of tons of steam produced. Steam quality is measured in terms of temperature and pressure as registered from boiler piping to the header. The production rate is measured in tons per hour.
At the plant level, higher-level DPMs included aggregates of steam cost, contribution margin (customer revenue less variable costs), steam quality, and production rate.
A set of complex, key cost calculations that addressed all major boiler operational factors were developed, then converted into algorithms that drove the set of DPMs programmed into the DCS platforms. This enables the real-time tracking of cost factors through the assets on the plant floor. The unit level metrics are aggregated at the station and plant levels with the aid of the historian. Totals can be performed at various periods, including shift, day, and month. Real-time financial data plus allocated costs tracked by an activity-based costing system provide a real-time picture of total product costs.
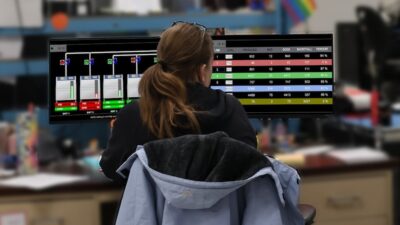
Each group—including plant floor operators, control engineers, and management—now has graphical dashboard displays of DPMs specific to their individual tasks and functions. Of primary importance on each dashboard are a set of dials that indicate current performance.
“The algorithms that drive those dials resulted from all the analysis we did,” says Barr. “The dials provide three basic views specific to each person’s domain—a financial perspective, a strategic one, and an operational one.” Priority of importance of the dials, in terms of strategic enterprise performance, is left to right for each individual’s domain, with the cost dial being on the left, as it is the top priority.
Employees actively use the dashboards to drill down to greater detail. “You might drill down to view the factors impacting the cost per ton of steam generated. If there’s a problem, maybe it’s because electricity is through the roof. On the right side of the dashboard, you might look into operations, at boiler efficiency and emissions, for example. If costs are really high, an operator might decide to back the boiler down. Or if customer demand goes up, you might decide to run the boiler harder,” Barr explains.
Management dashboards are supported via a desktop portal into the Aspentech data historian. “The plant manager looks at total costs—what he’s measured against on his P&L. Now he can proactively address cost problems, knowing daily if there’s a problem with performance against budget, rather than finding out at the month end, as was the case before,” Barr says. “He can drill down to see whether, perhaps, it’s a training problem, or maybe a coal quality issue.” The dashboard elements support continual monitoring and evaluation for how the plant is performing against budget in order to help everyone drive business performance.
From the project’s start, one of the key opportunities for improving business performance was identified as training operators to think and act more strategically.
Dashboard displays now provide operators clear and simple feedback on actions and their impact on Sasol’s strategic business priorities. The dashboard DPMs provide them a clear and unequivocal picture of cost performance over things they can affect by taking action. They now can see, in near real time, how adjustment to fuel-oil burn, stack flares, and coal feed mill rates, for example, move dashboard dials in the right direction—toward achieving lower costs.
Sasol reports that early results from the pilot project indicate that the impact of the Dynamic Performance Measures initiative is far exceeding anticipated savings of $400,000 annually. This was largely achieved due to reduction in expensive energy feedstock and electricity consumption.
With that success, the company is looking to a more extensive rollout across other operations. Using multivariate statistical analysis, the performance measurement information may be combined with other process data to identify additional areas of improvement and feed continuous improvement programs, such as Six Sigma, to achieve even greater business value gains.
Author Information
Frank O Smith is a contributing writer for Control Engineering. Post your comments online at