Much like how overall equipment effectiveness (OEE) revolutionized discrete manufacturing performance, overall controller effectiveness (OCE) is now helping process manufacturers consolidate complex process control data into easily used scorecard values, helping them better understand operations and make meaningful efficiency and productivity improvements with rapid paybacks.

Learning objectives
- Understand how overall controller effectiveness can help manufacturers consolidate complex process control data into easy-to-understand values.
- Learn how proportional-integral (PID) control loop performance monitoring (CLPM) software can help plants make sense of data volumes, conduct analyses and optimize process automation systems.
- Discover how to communicate results of these analyses to management to make actionable changes.
Discrete manufacturing insights
- Overall equipment effectiveness (OEE) has long been the standard metric for discrete manufacturing.
- Using overall controller effectiveness (OCE), users can spot performance outliers and take action to correct them.
Much like how overall equipment effectiveness (OEE) revolutionized discrete manufacturing performance, overall controller effectiveness (OCE) is now helping process manufacturers consolidate complex process control data into easily used scorecard values, helping them better understand operations and make meaningful efficiency and productivity improvements with rapid paybacks.
While an overabundance of data may not be as problematic as a scarcity, neither scenario is ideal. Over the past few years, many industrial processing plants have transitioned from the one extreme of extracting scanty and manually sourced data, to the other extreme of receiving a flood of automatically logged data. As a result, many operations teams are forced to transition from a low-visibility situation into a more overwhelming situation.
Proportional-integral-derivative (PID) control loop performance monitoring (CLPM) software provides a key tool for helping plant personnel make sense of these massive data volumes, conduct analyses and optimize their process automation systems. Even so, there remains a need to understand how to best prioritize activities and integrate them into work processes that support timely decision-making.
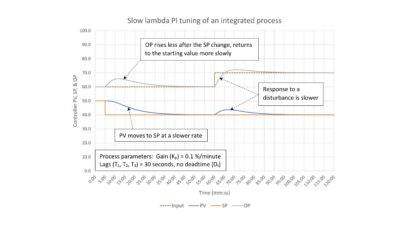
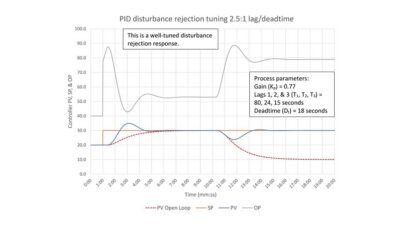
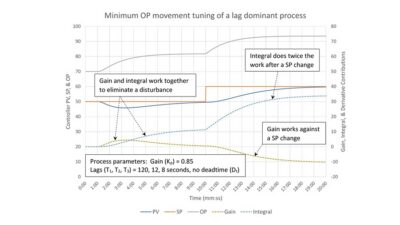
Additionally, communicating the results to management and linking actions to business results are also important aspects (see Figure 1).
Recognizing the acute need to further simplify and streamline process optimization efforts, a leading CLPM solution provider has developed a new metric, software tools and services. Namely, the OCE metric joins the rank of key performance indicators (KPIs) that help end users — from the plant floor up to the corporate office –– better understand and improve their operations by presenting performance in a normalized and easy-to-understand scorecard format, so they can readily compare equipment, production lines and even entire sites.
Extending a proven optimization concept
Discrete manufacturing companies managing factory-based machining, assembly lines, logistics and other activities have long faced the same challenges as their continuous processing plant counterparts. They have substantial volumes of raw data at hand but need ways to transform this into useful information so they can make optimal decisions and communicate throughout the organization.
To address this need, OEE became universally accepted in the discrete manufacturing world since its introduction in the 1980s. OEE is a composite value formulated by multiplying the following three input characteristics, each normalized from 0% to 100%, which results in an OEE output ranging from 0% to 100%:
- Availability: running without unplanned stops
- Performance: running normally and as fast as possible without constraints
- Quality: producing good parts without defects
While OEE is not a precise measure, it does provide a consistent way of evaluating the performance of a single machine, a production line and even an entire plant. Furthermore, it is a high-level tool, usable by all team members, for providing guidance regarding improvement opportunities.

The new OCE metric builds on the concept of OEE but is tailored to provide a simplified approach for process control industries (see Figure 2). Continuous processes generate massive amounts of field-sourced data, such as flow, pressure and temperature, along with significant derived and calculated values. It is nearly impossible for any human to look at raw data lists or even trends and determine whether production is running efficiently or not or to determine the root cause of any potential problems. OCE is a composite value designed to communicate this vital knowledge by distilling essential information from masses of data, based on the three most relevant process control characteristics, providing an OCE output ranging from 0 to 100%:
- Availability: running in normal mode without being overridden
- Performance: controller output (CO) running within its designed range without constraints
- Quality: process variable (PV) operating near setpoint (SP) within acceptable limits
There are many reasons for loops to behave poorly. Sometimes the control logic is flawed, or the operations team takes a loop out of its designated “normal” mode because they lack confidence in the control system. Perhaps a mechanical element is improperly sized, sticking or broken, leading to a windup of the CO. In many cases, poor tuning causes oscillations or an otherwise unacceptable mismatch between PV and SP. Even if the physical control loop is working well, there may be other related problems — such as historian misconfiguration, computer operating system updates and connectivity issues — which may fly under the radar.
Using OCE, users can quickly spot performance outliers like these and take action to correct them. The benefits of PID loop tuning software, advanced regulatory control loop analytics and CLPM solutions are already well known and will continue to play an important role in detailed troubleshooting and optimization efforts. Adding OCE to the toolchest further equips process manufacturers with an intuitive means for benchmarking control at the unit- and plant-wide level and for identifying specific areas that are undermining performance and productivity.
Scaling OCE throughout the enterprise
CLPM solutions, such as PlantESP from Control Station, are built on decades of company experience and contain a library of key performance indicators (KPIs) and analytical tools that support the work of process manufacturers worldwide. These production companies make massive investments in their operational assets, as well as in support tools like CLPM software and in employee training, so they are eager to maximize value.
Most users find that the best approach to do so is creating operational procedures where the CLPM information is integrated into the decision-making process — on a daily, weekly or other periodic basis — with a structured way to follow up and quantify results. Production companies are already familiar with periodic maintenance schedules for pumps and valves, and it makes sense to extend the proven maintenance cycle to address process functionality in much the same way.
To help end users in these efforts, Control Station also offers Digital Lifecycle Solutions (DLS), a tiered service offering designed to align with unique end user needs. DLS enables end users to engage as strategic partners in a defined periodic manner, consistently moving through the operational life cycle phases of identifying issues, implementing improvements and maintaining performance (see Figure 3).

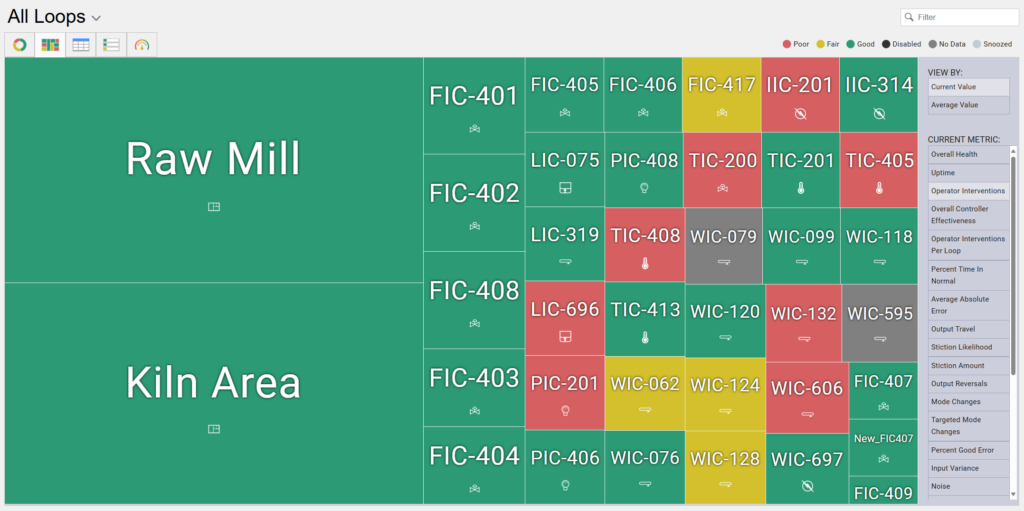
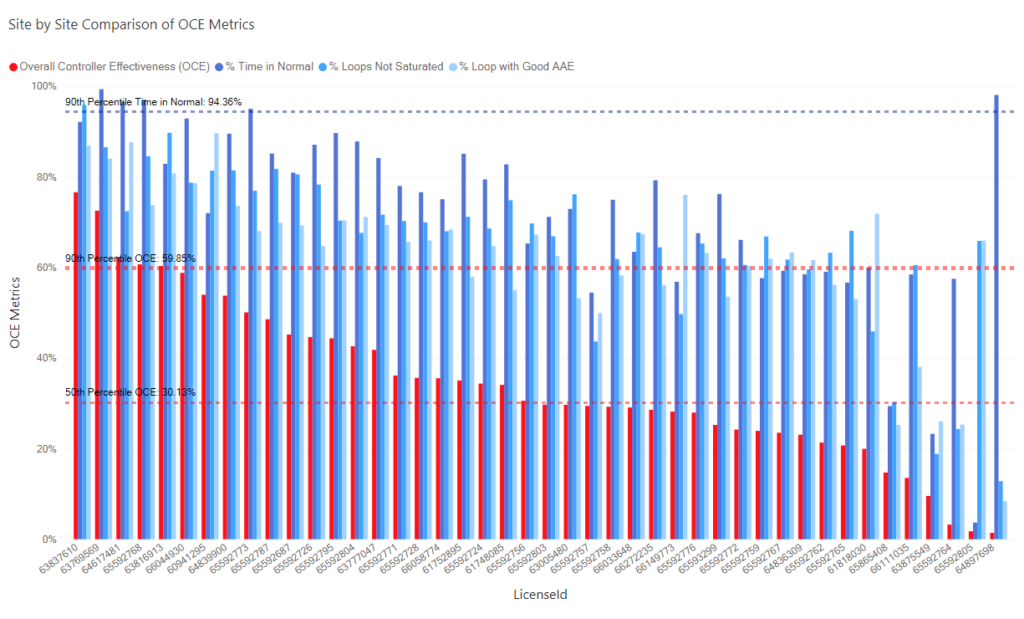
Operators and supervisors know how loops should behave, while maintenance and engineering personnel are often more familiar with detailed PID tuning parameters. Management, on the other hand, is typically most concerned with the broader issue of how well my plant is running today. OCE has become a chief tool for DLS teams to communicate essential information amongst all these stakeholders, using a straightforward scorecard format (see Figure 4). And now, OCE availability is being expanded from the DLS service and into the PlantESP product.
Depending on the need, OCE values can be associated with a single control loop or aggregated and weighted to encompass:
- One specific asset or an entire fleet of them
- A production unit or train
- An entire plant
- Or even multiple facilities
Although OCE is well-suited for comparing similar loops, it is flexible enough to provide meaningful comparisons among disparate operations. A recent study performed at the University of Connecticut examined OCE values for 30 different plants, ranging in size from 180 to 4,000 loops per plant. The results indicated that OCE is truly an independent metric, not based on the type or number of loops, but rather with a high correlation to engineering and performance quality.
OCE provides a simple and uniform method of benchmarking and gauging performance via an intuitive at-a-glance view, so optimization efforts can be directed strategically. Users find it easier to determine if facility performance has changed and to evaluate what the root causes might be.
Navigating toward positive business results
A well-tuned control loop improves operational characteristics including quality, production rate, energy consumption, wear and others. OCE directly transforms raw data into a simple, trackable value correlated with all these outcomes. In addition, OCE supports reliability efforts. The DLS team has seen an example where OCE for a loop dropped unexpectedly, but the client decided to defer looking into it until the next weekly meeting. Unfortunately, a valve failed within that time frame, pointing out the usefulness of OCE as a prognostic of an impending failure.
PlantESP and OCE are quickly deployed at any site, tapping into existing data historians and delivering rapid return on investment. Clients engaging with DLS benefit from periodic review sessions, where a bite-sized group of worst-performing loops are identified in combination with recommendations for corrective action.
In the process industries, there is a common rule of thumb that automation represents approximately 10% of the capital cost for new production plants. Indeed, many end users expend between $10,000 to $20,000 for hardware, software and labor associated with configuring a single PID loop. At such a cost, ensuring continued performance and quality is critical to maximizing the return on these investments. Intuitive metrics like OCE help world-class process manufacturers to transform massive amounts of raw data into actionable information and to maintain their pursuit of peak production.